The 7 KPIs Every Finance Team Should Track After Implementing AI Payment Recovery

Introduction
Payment failures are silently bleeding revenue from subscription businesses at an alarming rate. Up to 70% of involuntary churn stems from failed transactions—customers who never intended to leave but are forced out when a card is declined (Slicker). With decline rates reaching 30% in some industries, each failed payment represents a potential lost subscriber (Slicker).
The stakes couldn't be higher: a staggering 62% of users who hit a payment error never return to the site (Slicker). Meanwhile, involuntary churn can easily comprise 40% of your total churn, depending on the nature of your business (Churnkey). For finance teams implementing AI-powered payment recovery solutions, tracking the right KPIs becomes critical to measuring success and optimizing performance.
Using Slicker's Q2 2025 benchmark data and industry insights, we'll define seven essential KPI formulas that every finance team should monitor. These metrics will help you quantify the impact of AI payment recovery against the industry's 9% revenue-loss baseline and provide Google Sheets templates to instrument these measurements within 24 hours.
The Current State of Payment Recovery in 2025
The payment recovery landscape has evolved dramatically with the integration of artificial intelligence. Machine-learning engines now predict the perfect moment, method, and gateway for each retry, lifting recovery rates 2-4× above native billing logic (Slicker). This technological advancement comes at a crucial time, as subscription revenue faces increasing pressure from payment failures.
Involuntary churn generally hovered around 1% in 2024, while voluntary churn centered around 7%, with overall churn hovering near 10% throughout the year (Churnkey). However, these numbers tell only part of the story. The complexity of modern payment ecosystems, with multiple gateways and evolving card networks, creates new challenges that traditional retry logic cannot address effectively.
AI gateways have emerged as a solution to manage this complexity by acting as a central routing point, enabling businesses to interact with multiple payment providers through a single, unified API (AI Multiple). This technological shift mirrors broader AI developments, with artificial intelligence becoming an increasingly autonomous and deeply integrated force in business operations as of June 2025 (Medium).
Why KPI Tracking Matters for AI Payment Recovery
Implementing AI payment recovery without proper measurement is like flying blind. Finance teams need concrete metrics to justify the investment, optimize performance, and demonstrate ROI to stakeholders. The challenge lies in identifying which metrics truly matter and how to calculate them accurately.
Traditional payment recovery systems often lack the granular data needed for sophisticated analysis. AI-powered platforms process each failing payment individually and convert past-due invoices into revenue (Slicker), providing rich datasets that enable deeper insights into recovery performance.
The key is establishing baseline measurements before implementation and tracking improvements over time. Machine-learning initiatives typically deliver "productivity improvement in the mid-teens to the high twenties" according to McKinsey research, but quantifying this impact requires systematic KPI tracking (Slicker).
The 7 Essential KPIs for AI Payment Recovery
1. Recovered MRR Percentage
Formula: (Recovered MRR / Total Failed MRR) × 100
Why it matters: This metric directly measures your AI system's effectiveness at converting failed payments back into recurring revenue. It's the most straightforward indicator of recovery success.
Benchmark: Industry-leading AI platforms achieve 2-4× better recovery than native billing-provider logic (Slicker). If your baseline recovery rate was 15%, expect AI implementation to push this to 30-60%.
Google Sheets Implementation:
=SUMIF(Recovery_Status,"Recovered",MRR_Amount)/SUMIF(Payment_Status,"Failed",MRR_Amount)*100
Tracking frequency: Daily for operational monitoring, weekly for trend analysis, monthly for executive reporting.
2. Time-to-Cash Recovery
Formula: Average days from payment failure to successful recovery
Why it matters: Faster recovery means improved cash flow and reduced customer friction. AI systems excel at identifying optimal retry timing, often recovering payments within hours rather than days.
Benchmark: Traditional dunning systems average 7-14 days for recovery. AI-powered systems should reduce this to 2-5 days on average.
Google Sheets Implementation:
=AVERAGE(Recovery_Date-Failure_Date)
Advanced tracking: Segment by failure reason (expired card, insufficient funds, network error) to identify which scenarios benefit most from AI optimization.
3. Soft-Decline Uplift Rate
Formula: (AI Soft-Decline Recovery Rate - Baseline Soft-Decline Recovery Rate) / Baseline Soft-Decline Recovery Rate × 100
Why it matters: Soft declines are temporary issues that can be resolved primarily with card retries, requesting a backup card, and dunning recovery campaigns (Churnkey). AI excels at optimizing retry timing and method selection for these recoverable failures.
Benchmark: Expect 20-40% uplift in soft-decline recovery rates with AI implementation.
Google Sheets Implementation:
=(Current_Soft_Recovery_Rate-Baseline_Soft_Recovery_Rate)/Baseline_Soft_Recovery_Rate*100
4. Gateway Success Rate Optimization
Formula: Successful transactions per gateway / Total attempts per gateway × 100
Why it matters: AI systems route payments across multiple gateways to maximize success rates (Slicker). This metric helps identify which gateways perform best for different customer segments and failure types.
Benchmark: Multi-gateway routing typically improves overall success rates by 10-25% compared to single-gateway approaches.
Google Sheets Implementation:
=COUNTIFS(Gateway,"Gateway_A",Status,"Success")/COUNTIF(Gateway,"Gateway_A")*100
5. Customer Retention Impact Score
Formula: (Customers retained through AI recovery / Total at-risk customers) × 100
Why it matters: This metric connects payment recovery directly to customer lifetime value. Since it's 5-7× cheaper to save an existing subscriber than acquire a new one (Slicker), this KPI demonstrates the broader business impact beyond immediate revenue recovery.
Benchmark: AI payment recovery should retain 60-80% of customers who would otherwise churn due to payment failures.
Google Sheets Implementation:
=COUNTIFS(Recovery_Status,"Successful",Customer_Status,"Retained")/COUNTIF(Payment_Status,"Failed")*100
6. Revenue Recovery ROI
Formula: (Additional Revenue Recovered - AI Platform Costs) / AI Platform Costs × 100
Why it matters: This metric justifies the investment in AI payment recovery by comparing costs against incremental revenue gains. It's essential for budget planning and stakeholder buy-in.
Benchmark: Well-implemented AI payment recovery systems typically achieve 300-500% ROI within the first year.
Google Sheets Implementation:
=(Additional_Recovered_Revenue-Platform_Costs)/Platform_Costs*100
7. Involuntary Churn Reduction Rate
Formula: (Baseline Involuntary Churn Rate - Current Involuntary Churn Rate) / Baseline Involuntary Churn Rate × 100
Why it matters: This metric measures the ultimate goal of AI payment recovery: reducing customers lost due to payment failures. Involuntary churn not only leads to lost revenue but also the need to regain churned customers (Drips).
Benchmark: AI implementation should reduce involuntary churn by 40-70% compared to baseline rates.
Google Sheets Implementation:
=(Baseline_Involuntary_Churn-Current_Involuntary_Churn)/Baseline_Involuntary_Churn*100
KPI Dashboard Template and Implementation Guide
Setting Up Your Google Sheets Dashboard
To implement these KPIs effectively, create a centralized dashboard that updates automatically with your payment data. Here's a step-by-step approach:
Step 1: Data Collection Setup
- Connect your payment processor API to Google Sheets using tools like Zapier or native integrations
- Ensure data includes: transaction ID, customer ID, amount, failure reason, retry attempts, recovery status, and timestamps
- Set up automated daily data pulls to maintain real-time accuracy
Step 2: KPI Calculation Sheet Create separate tabs for:
- Raw payment data
- KPI calculations
- Dashboard visualizations
- Historical trending
Step 3: Automated Reporting Implement conditional formatting to highlight:
- KPIs below benchmark thresholds (red)
- KPIs meeting targets (green)
- Trending improvements (blue)
Advanced Analytics Integration
For teams requiring more sophisticated analysis, consider integrating with business intelligence tools. The data structure should support segmentation by:
- Customer cohorts
- Payment methods
- Geographic regions
- Subscription tiers
- Failure reasons
This granular approach enables identification of specific areas where AI payment recovery delivers the highest impact.
Industry Benchmarks and Performance Targets
Q2 2025 Benchmark Data
Based on industry analysis and platform performance data, here are realistic targets for each KPI:
| KPI | Baseline (Pre-AI) | Target (Post-AI) | Best-in-Class |
|---|---|---|---|
| Recovered MRR % | 15-25% | 35-50% | 60%+ |
| Time-to-Cash (days) | 7-14 | 2-5 | 1-2 |
| Soft-Decline Uplift | N/A | 20-40% | 50%+ |
| Gateway Optimization | Single gateway | 10-25% improvement | 30%+ improvement |
| Customer Retention | 40-60% | 70-85% | 90%+ |
| Revenue Recovery ROI | N/A | 300-500% | 700%+ |
| Involuntary Churn Reduction | N/A | 40-70% | 80%+ |
Setting Realistic Expectations
Implementation success varies based on several factors:
- Industry type: E-commerce and SaaS typically see higher recovery rates than traditional services
- Customer base: B2B customers often have more predictable payment patterns than B2C
- Payment mix: Credit cards generally have higher recovery rates than ACH or bank transfers
- Geographic distribution: Different regions have varying payment infrastructure reliability
AI-powered platforms like Slicker support multiple billing providers including Stripe, Chargebee, Recurly, Zuora, and Recharge (Slicker), enabling comprehensive recovery optimization across diverse payment ecosystems.
Implementation Timeline and Quick Wins
24-Hour Setup Guide
Hour 1-4: Data Preparation
- Export 90 days of historical payment data
- Identify baseline metrics for comparison
- Set up Google Sheets template with KPI formulas
Hour 5-12: AI Platform Integration
- Configure AI payment recovery platform
- Test data flow and validation
- Verify KPI calculations with sample data
Hour 13-20: Dashboard Creation
- Build visualization charts
- Set up automated reporting
- Configure alert thresholds
Hour 21-24: Team Training and Launch
- Train finance team on dashboard usage
- Establish monitoring procedures
- Begin daily KPI tracking
Week 1-4: Optimization Phase
The first month focuses on fine-tuning AI parameters and validating KPI accuracy:
- Week 1: Monitor basic recovery metrics and data quality
- Week 2: Analyze gateway performance and routing optimization
- Week 3: Assess customer retention impact and segment analysis
- Week 4: Calculate ROI and prepare first monthly report
Common Pitfalls and How to Avoid Them
Data Quality Issues
Problem: Inconsistent or incomplete payment data leading to inaccurate KPI calculations.
Solution: Implement data validation rules and regular audits. Ensure all payment events are properly tagged and timestamped.
Benchmark Misalignment
Problem: Using industry averages that don't reflect your specific business model or customer base.
Solution: Establish your own baseline metrics before AI implementation. Industry benchmarks should guide expectations, not define success.
Over-Optimization
Problem: Focusing too heavily on short-term recovery metrics while ignoring customer experience impact.
Solution: Balance recovery aggressiveness with customer satisfaction. Monitor support ticket volume and customer feedback alongside financial KPIs.
Insufficient Segmentation
Problem: Treating all payment failures equally without considering customer value or failure context.
Solution: Implement tiered recovery strategies based on customer lifetime value, subscription tier, and failure reason.
Advanced KPI Analysis and Optimization
Cohort-Based Recovery Analysis
Segment your KPI tracking by customer cohorts to identify patterns:
- New customers: Often have higher failure rates due to card validation issues
- Long-term customers: May have outdated payment information requiring proactive updates
- High-value customers: Deserve prioritized recovery efforts and personalized outreach
Predictive KPI Modeling
Leverage AI capabilities for forward-looking analysis:
- Failure prediction: Identify customers likely to experience payment issues before they occur
- Recovery probability: Score failed payments by likelihood of successful recovery
- Churn risk assessment: Flag customers at highest risk of involuntary churn
Cross-Platform Integration
Modern AI payment recovery systems integrate with multiple platforms and services. Platforms like Slicker offer 5-minute setup with no code changes, plugging into major billing providers (Slicker). This integration capability enables comprehensive KPI tracking across your entire payment ecosystem.
ROI Calculation and Business Case Development
Building the Financial Case
To secure ongoing investment in AI payment recovery, finance teams must demonstrate clear ROI. The calculation should include:
Direct Benefits:
- Recovered MRR from failed payments
- Reduced customer acquisition costs (retained vs. new customers)
- Decreased manual intervention costs
Indirect Benefits:
- Improved customer satisfaction and loyalty
- Enhanced cash flow predictability
- Reduced support ticket volume
Sample ROI Calculation
For a SaaS company with $1M monthly recurring revenue:
- Monthly payment failures: $120,000 (12% failure rate)
- Baseline recovery: $18,000 (15% recovery rate)
- AI-enhanced recovery: $60,000 (50% recovery rate)
- Additional monthly recovery: $42,000
- Annual additional recovery: $504,000
- AI platform cost: $100,000 annually
- Net ROI: 404%
This calculation demonstrates why AI payment recovery platforms often operate on pay-for-success pricing models, aligning vendor incentives with customer outcomes (Slicker).
Future-Proofing Your KPI Strategy
Emerging Trends in Payment Recovery
The AI landscape continues evolving rapidly. Recent developments like Grok 4's multi-agent systems represent a paradigm shift from traditional single-threaded AI processing (Dev.to). These advances suggest future payment recovery systems will become even more sophisticated in their analysis and decision-making capabilities.
Preparing for Regulatory Changes
As payment recovery becomes more automated, regulatory compliance becomes increasingly important. Ensure your KPI tracking includes:
- Compliance monitoring metrics
- Customer communication tracking
- Data privacy and security measures
- Audit trail maintenance
Scaling Considerations
As your business grows, your KPI framework should scale accordingly:
- Multi-currency support: Track recovery rates across different currencies and regions
- Product-specific metrics: Segment KPIs by product lines or service tiers
- Channel optimization: Monitor performance across different sales channels
Conclusion
Implementing AI payment recovery without proper KPI tracking is a missed opportunity to maximize ROI and optimize performance. The seven KPIs outlined in this guide provide a comprehensive framework for measuring success and identifying optimization opportunities.
The key to success lies in establishing accurate baselines, implementing consistent tracking procedures, and using data-driven insights to continuously improve recovery performance. With AI-powered platforms delivering 2-4× better recovery than traditional methods (Slicker), the potential impact on your bottom line is substantial.
By following the 24-hour implementation guide and Google Sheets templates provided, finance teams can quickly establish robust KPI tracking and begin realizing the benefits of AI payment recovery. Remember that successful implementation requires ongoing monitoring, optimization, and alignment with broader business objectives.
The investment in proper KPI tracking pays dividends through improved decision-making, enhanced stakeholder confidence, and ultimately, better financial performance. As the payment landscape continues evolving, teams with strong measurement capabilities will be best positioned to adapt and thrive.
Frequently Asked Questions
What are the most important KPIs to track after implementing AI payment recovery?
The 7 essential KPIs include payment recovery rate, time to recovery, false positive rate, customer retention impact, revenue recovery amount, decline reason analysis, and customer satisfaction scores. These metrics help finance teams measure the effectiveness of their AI payment recovery system against the industry baseline of 9% revenue loss from failed payments.
How much revenue can businesses lose from payment failures without AI recovery?
According to industry data, up to 70% of involuntary churn stems from failed transactions, with decline rates reaching 30% in some industries. The industry baseline shows businesses typically lose around 9% of their revenue due to payment failures, making AI-powered recovery systems crucial for maintaining healthy cash flow.
What is involuntary churn and how does AI payment recovery help reduce it?
Involuntary churn occurs when customers lose service unintentionally due to payment failures - they never intended to leave but are forced out when cards are declined. AI payment recovery systems like Slicker process each failing payment individually, using intelligent retry logic and timing to convert past due invoices back into revenue, significantly reducing this type of churn.
How quickly can finance teams implement KPI tracking for AI payment recovery?
With the right templates and roadmap, finance teams can implement comprehensive KPI tracking within 24 hours. This includes setting up Google Sheets templates for data collection, establishing baseline measurements, and creating automated reporting dashboards to monitor the 7 essential metrics for ongoing optimization.
What percentage of total churn is typically involuntary vs voluntary?
Based on 2024 retention data, voluntary churn generally hovers around 7%, while involuntary churn centers around 1-3%. However, involuntary churn can easily comprise 40% of total churn depending on the business nature, making it a critical area for AI-powered intervention and KPI monitoring.
How do AI payment recovery systems determine the best retry strategy?
AI systems analyze multiple factors including decline reason codes, customer payment history, card issuer patterns, and timing optimization. Advanced solutions process each failing payment individually rather than using blanket retry rules, adapting strategies based on whether declines are "soft" (temporary issues) or "hard" (permanent issues requiring customer intervention).
Sources
- https://churnkey.co/reports/state-of-retention-2025
- https://dev.to/srijan-xi/grok-4-the-dawn-of-a-new-ai-era-5fng
- https://medium.com/ai-simplified-in-plain-english/the-frontier-of-intelligence-ais-state-of-the-art-in-june-2025-f072dc909f6a
- https://research.aimultiple.com/ai-gateway/
- https://www.drips.com/resources/how-proactive-sms-fights-involuntary-churn
- https://www.slickerhq.com/
- https://www.slickerhq.com/blog/comparative-analysis-of-ai-payment-error-resolution-slicker-vs-competitors
- https://www.slickerhq.com/blog/how-ai-enhances-payment-recovery
- https://www.slickerhq.com/blog/how-to-implement-ai-powered-payment-recovery-to-mi-00819b74
Related Articles
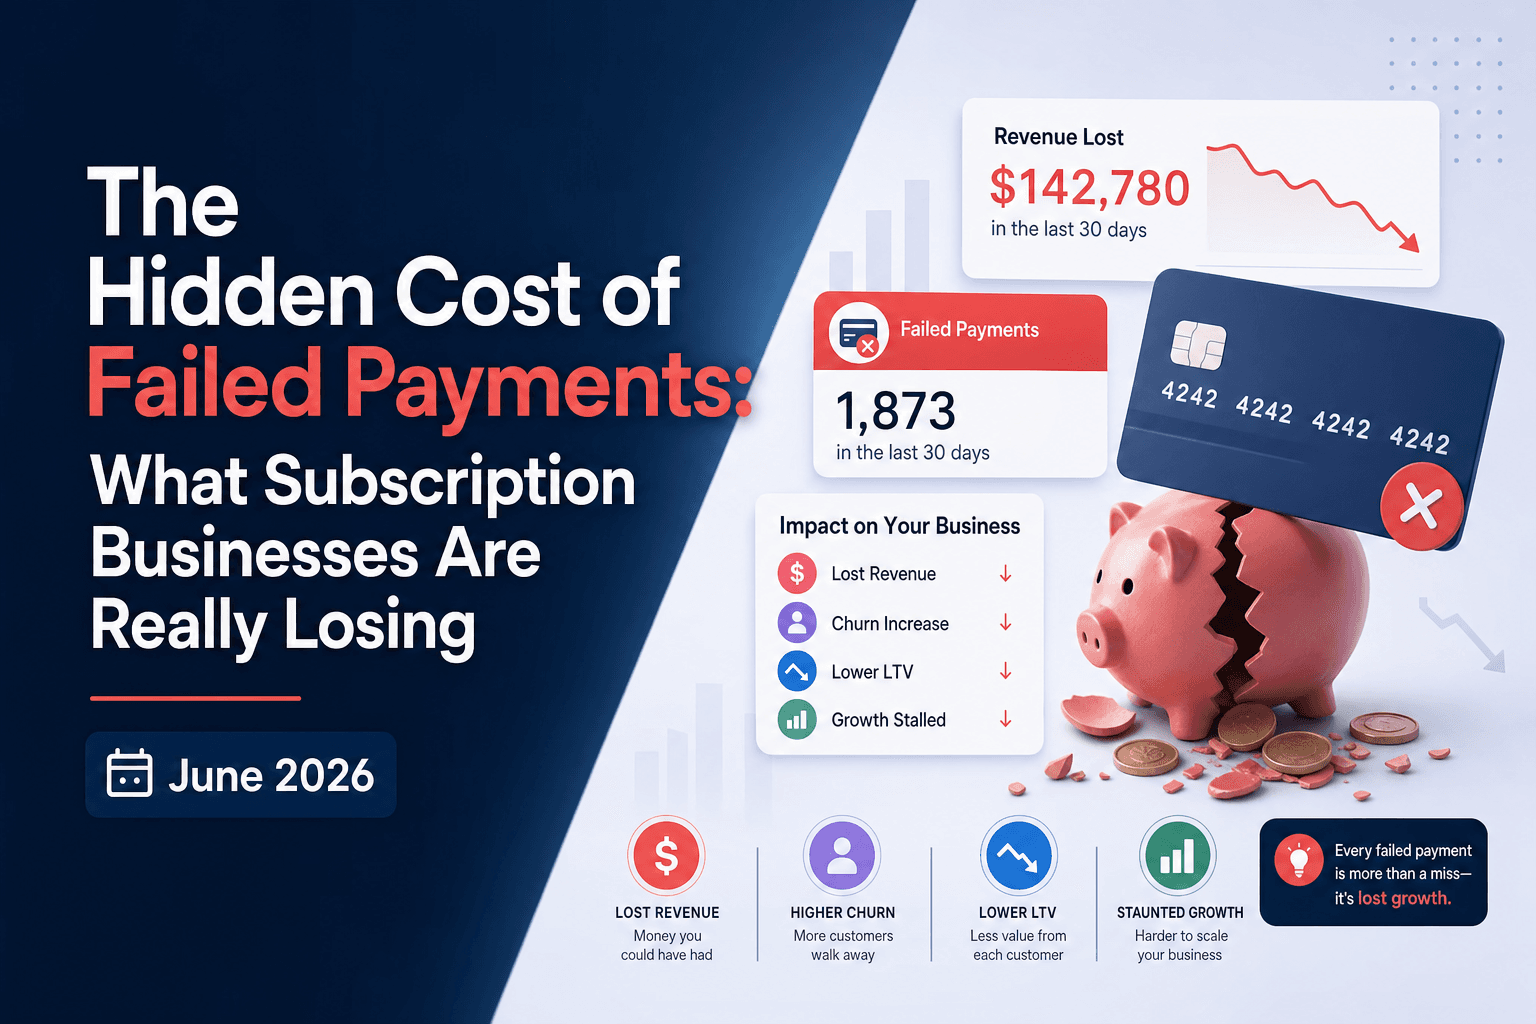
The Hidden Cost of Failed Payments: What Subscription Businesses Are Really Losing (June 2026)
Failed payments cost subscription businesses far more than the missed transaction. The visible hit is immediate MRR loss, but that's only the first layer. When...
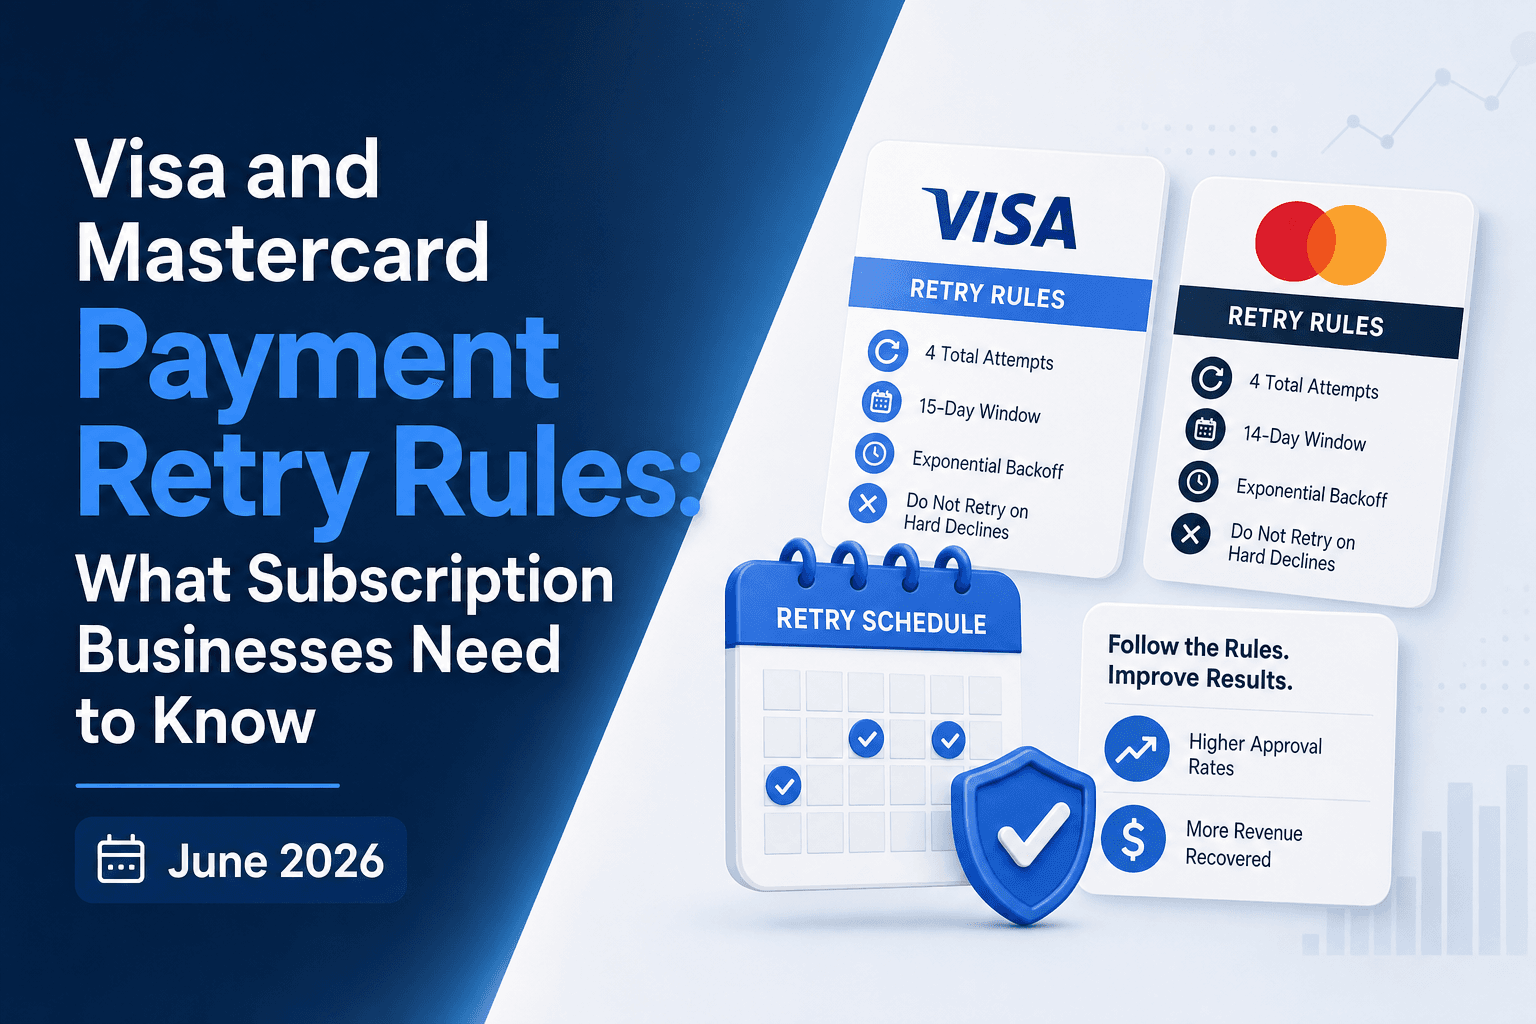
Visa and Mastercard Payment Retry Rules: What Subscription Businesses Need to Know (June 2026)
Every subscription business deals with failed payments. The question is whether your retry strategy follows Visa and Mastercard payment retry rules or...
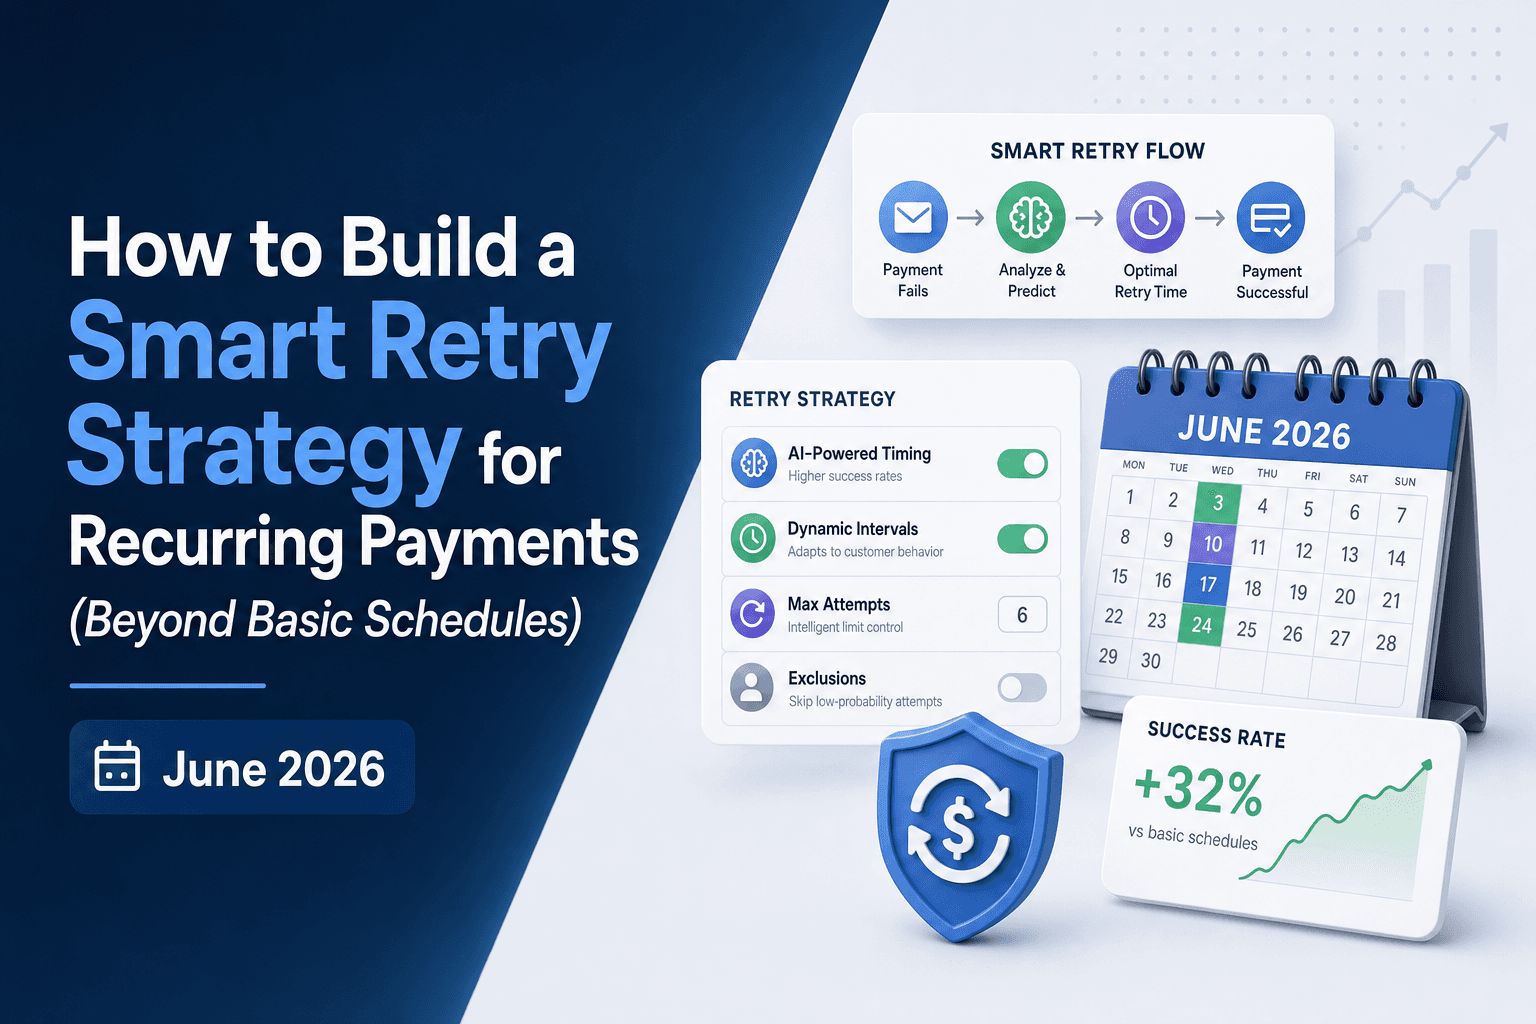
How to Build a Smart Retry Strategy for Recurring Payments (Beyond Basic Schedules) (June 2026)
Failed payments cost you more than the lost transaction. Every decline that sits in a generic retry queue is a subscriber you already earned, slipping into...
Stop losing revenue to failed payments
Join leading subscription businesses using Slicker to recover failed payments automatically.
Get Started