Calculating the Hidden Cost of Failed Payments in 2025: A Revenue-Loss Model You Can Copy

Introduction
Involuntary churn is projected to bleed $129 billion from subscription companies in 2025. (State of Retention 2025 | Churnkey) While most founders obsess over customer acquisition costs and voluntary churn, they're missing a massive revenue leak hiding in plain sight: failed payments that turn loyal customers into involuntary churners.
The math is brutal. A $50 failed payment could actually cost your business thousands when you factor in lost customer lifetime value (LTV). (Slicker) In subscription businesses, the average customer stays for 24 months, meaning that $50 monthly subscription actually represents $1,200 in expected revenue. (Slicker)
This article provides a Google Sheets template that lets you plug in your MRR, decline rate, and recovery efficiency to see your exact exposure—and how improvements move the needle. We'll break down the hidden costs, show you the real impact on your bottom line, and give you a framework to calculate your own revenue-loss exposure.
The $129 Billion Problem: Understanding Involuntary Churn
Involuntary churn occurs when subscriptions are cancelled due to payment failures, not customer intent. (State of Retention 2025 | Churnkey) Unlike voluntary churn where customers actively decide to leave, involuntary churn happens when payment methods fail—expired cards, insufficient funds, bank security flags, or technical glitches.
The scale of this problem is staggering. Involuntary churn can represent up to 30% of total customer churn for subscription businesses. (Slicker) For high-growth SaaS companies, card declines, bank rejections, and soft errors collectively wipe out as much as 4% of MRR. (Slicker)
The Two Types of Payment Failures
Payment failures fall into two categories:
Soft Declines (Temporary Issues)
- Insufficient funds
- Network connectivity problems
- Bank security flags
- Temporary card blocks
Hard Declines (Permanent Issues)
- Expired or cancelled cards
- Closed bank accounts
- Fraudulent transactions
- Invalid card details
Stripe's research indicates that involuntary churn makes up 25% of all subscription cancellations. (How to resolve failed Stripe recurring payments?) This means one in four customers who leave your service didn't actually want to—they were forced out by payment infrastructure failures.
The Hidden Costs Beyond Lost Revenue
1. Customer Lifetime Value Destruction
The most significant hidden cost lies in the lost customer lifetime value (LTV). (Slicker) When a $50 monthly subscriber churns involuntarily, you're not just losing $50—you're losing their entire future revenue stream.
Here's the calculation:
- Average customer lifespan: 24 months
- Monthly subscription: $50
- Lost LTV: $50 × 24 = $1,200
2. Customer Acquisition Cost Multiplication
With SaaS Customer Acquisition Costs (CAC) averaging $205 and rising yearly, each involuntary churn forces you to spend significant marketing dollars just to stay in place. (Slicker)
The replacement cost formula:
- Lost customer LTV: $1,200
- Acquisition cost for replacement: $205
- Total impact: $1,405 per involuntary churn
3. Growth Rate Impact
Successful SaaS businesses typically see 15-40% of their revenue growth from existing customers. (Slicker) When involuntary churn removes these expansion opportunities, it creates a double hit:
- Lost base subscription revenue
- Lost expansion revenue potential
4. Operational Overhead
Failed payments trigger a cascade of operational costs:
- Customer support tickets
- Manual retry attempts
- Account recovery processes
- Dunning management
- Reactivation campaigns
The Revenue-Loss Calculator: Your Copy-and-Paste Model
Key Metrics You Need
Before diving into the calculator, gather these essential metrics from your business:
| Metric | Description | Typical Range |
|---|---|---|
| Monthly Recurring Revenue (MRR) | Total monthly subscription revenue | Varies by business |
| Payment Decline Rate | % of payments that fail monthly | 2-8% |
| Current Recovery Rate | % of failed payments you recover | 15-35% |
| Average Customer Lifespan | Months customers typically stay | 12-36 months |
| Customer Acquisition Cost (CAC) | Cost to acquire one new customer | $50-$500+ |
The Revenue-Loss Formula
Monthly Revenue Loss = MRR × Decline Rate × (1 - Recovery Rate)
Annual Revenue Loss = Monthly Revenue Loss × 12
LTV Impact = Monthly Revenue Loss × Average Customer Lifespan
Total Annual Impact = Annual Revenue Loss + (Monthly Churned Customers × CAC)
Example Calculation
Let's work through a real example:
Company Profile:
- MRR: $100,000
- Decline Rate: 4%
- Current Recovery Rate: 25%
- Average Customer Lifespan: 24 months
- CAC: $205
- Average Revenue Per User (ARPU): $50
Step 1: Calculate Monthly Failed Payment Revenue
Failed Payment Revenue = $100,000 × 4% = $4,000
Step 2: Calculate Unrecovered Revenue
Unrecovered Revenue = $4,000 × (1 - 25%) = $3,000
Step 3: Calculate Customer Impact
Monthly Churned Customers = $3,000 ÷ $50 ARPU = 60 customers
Step 4: Calculate Total Annual Impact
Direct Revenue Loss = $3,000 × 12 = $36,000
LTV Loss = $3,000 × 24 months = $72,000
Replacement CAC = 60 customers × 12 months × $205 = $147,600
Total Annual Impact = $36,000 + $72,000 + $147,600 = $255,600
Google Sheets Template Structure
Create a spreadsheet with these columns:
| Input Variables | Your Value | Industry Benchmark |
|---|---|---|
| Monthly Recurring Revenue | $100,000 | Varies |
| Payment Decline Rate (%) | 4% | 2-8% |
| Current Recovery Rate (%) | 25% | 15-35% |
| Average Customer Lifespan (months) | 24 | 12-36 |
| Customer Acquisition Cost | $205 | $50-$500+ |
| Average Revenue Per User | $50 | Varies |
| Calculated Results | Formula | Your Result |
|---|---|---|
| Monthly Failed Revenue | MRR × Decline Rate | $4,000 |
| Monthly Unrecovered Revenue | Failed Revenue × (1 - Recovery Rate) | $3,000 |
| Monthly Churned Customers | Unrecovered Revenue ÷ ARPU | 60 |
| Annual Direct Loss | Monthly Unrecovered × 12 | $36,000 |
| Annual LTV Loss | Monthly Unrecovered × Lifespan | $72,000 |
| Annual Replacement Cost | Churned Customers × 12 × CAC | $147,600 |
| Total Annual Impact | Sum of all losses | $255,600 |
Industry Benchmarks and Reality Check
SaaS Churn Rate Benchmarks
According to 2024 data, cancellations contribute to a churn index of 3.2%, accounting for 71.1% of total churn-related revenue loss. (SaaS Churn Rate Benchmarks 2024) Downgrades contribute an additional 1.3% to the churn index, accounting for 28.9% of total churn-related revenue loss. (SaaS Churn Rate Benchmarks 2024)
The total churn-related revenue loss for SaaS companies averages 4.5%. (SaaS Churn Rate Benchmarks 2024) This means if you're experiencing higher involuntary churn rates, you're significantly above industry benchmarks.
Payment Recovery Benchmarks
Involuntary churn can comprise up to 40% of a business's total churn. (State of Retention 2025 | Churnkey) However, modern payment recovery solutions have evolved far beyond simple retry logic, using AI and sophisticated analytics to dramatically improve success rates. (Slicker)
Advanced AI-powered recovery systems can automatically recapture up to 50% of failed transactions. (FAQ on AI-Powered Payment Recovery | Vindicia) This represents a significant improvement over basic retry logic, which typically recovers only 15-25% of failed payments.
The ROI of Payment Recovery Improvements
Scenario Analysis: Recovery Rate Improvements
Using our example company, let's see how recovery rate improvements impact the bottom line:
| Recovery Rate | Monthly Loss | Annual Impact | Improvement vs 25% |
|---|---|---|---|
| 25% (Current) | $3,000 | $255,600 | Baseline |
| 35% (+10%) | $2,600 | $221,280 | $34,320 savings |
| 45% (+20%) | $2,200 | $187,200 | $68,400 savings |
| 55% (+30%) | $1,800 | $153,120 | $102,480 savings |
The 1% Rule
Every 1% lift in recovery can translate into tens of thousands of annual revenue for growing subscription businesses. (Slicker) In our example:
- 1% recovery improvement = $400 monthly savings
- Annual impact = $4,800 in direct revenue
- Plus LTV and CAC savings = $11,520 total annual impact
Modern Solutions: Beyond Basic Retry Logic
The Evolution of Payment Recovery
Traditional payment recovery relied on simple retry schedules—attempt the payment again in 3 days, then 7 days, then give up. This approach ignores the nuanced reasons why payments fail and treats all failures the same.
Modern payment recovery solutions have evolved far beyond simple retry logic, using AI and sophisticated analytics to dramatically improve success rates. (Slicker) Companies like Slicker are leading this evolution, using AI-powered recovery systems that integrate seamlessly with existing billing platforms to turn potential losses into sustained revenue. (Slicker)
AI-Powered Recovery Features
Intelligent Retry Timing AI analyzes historical success patterns to determine optimal retry timing for different failure types. Instead of generic 3-day intervals, the system might retry a "insufficient funds" decline in 2 days but wait 7 days for a "suspicious activity" flag.
Multi-Gateway Smart Routing AI enables auto-routing across gateways, a feature pioneered by specialized vendors. (Slicker) If Stripe fails, the system automatically routes to Adyen or another gateway, increasing success probability.
Failure Classification Advanced systems classify failures by type and likelihood of recovery, focusing efforts on the most recoverable transactions while avoiding futile retry attempts that could trigger fraud flags.
Real-World Performance Improvements
Slicker's AI-driven recovery engine claims "2-4× better recoveries than static retry systems." (Slicker) This improvement comes from intelligent retry timing, multi-gateway routing, and transparent analytics. (Slicker)
Similarly, Adyen's Uplift toolkit improved conversion by 6% through automated optimization. (Slicker) These improvements translate directly to bottom-line impact when applied to the revenue-loss model.
Implementation Strategy: From Calculation to Action
Step 1: Baseline Assessment
Use the revenue-loss calculator to establish your current exposure:
- Calculate monthly failed payment revenue
- Determine current recovery rate
- Assess total annual impact
- Identify improvement opportunities
Step 2: Solution Evaluation
The key is moving beyond basic retry logic to intelligent, adaptive solutions that understand each business's unique payment landscape. (Slicker)
Evaluate solutions based on:
- Recovery rate improvements
- Integration complexity
- Pricing model alignment
- Analytics and reporting capabilities
Step 3: ROI Justification
Use your revenue-loss model to justify investment in payment recovery solutions. If a solution costs $500/month but improves recovery by 10%, the ROI calculation is straightforward:
- Monthly cost: $500
- Monthly savings: $400 (from our example)
- Additional LTV and CAC benefits: $800
- Net monthly benefit: $700
- Annual ROI: 1,680%
Step 4: Implementation and Monitoring
Modern solutions like Slicker offer no-code integration with 5-minute setup, making implementation straightforward. (Slicker) The platform supports major billing providers including Stripe, Chargebee, Recurly, Zuora, and Recharge. (Slicker)
Key monitoring metrics:
- Recovery rate trends
- Revenue recovered monthly
- Customer retention improvements
- Support ticket reduction
Advanced Considerations and Edge Cases
Geographic and Currency Factors
Payment failure rates vary significantly by geography and currency. European markets often see higher decline rates due to Strong Customer Authentication (SCA) requirements, while emerging markets face infrastructure challenges.
Adjust your revenue-loss model for:
- Regional decline rate variations
- Currency-specific retry success rates
- Local payment method preferences
- Regulatory compliance costs
Seasonal and Business Cycle Impacts
Payment failures often spike during:
- Holiday seasons (increased spending limits)
- Economic downturns (insufficient funds)
- Back-to-school periods (budget constraints)
- End of fiscal years (corporate card renewals)
Incorporate seasonal adjustments into your annual projections to avoid underestimating impact during peak failure periods.
Customer Segment Analysis
Different customer segments exhibit varying payment failure patterns:
| Segment | Typical Decline Rate | Recovery Difficulty | LTV Impact |
|---|---|---|---|
| Enterprise | 1-3% | Low | High |
| SMB | 3-6% | Medium | Medium |
| Consumer | 5-10% | High | Low |
Segment your revenue-loss calculations to identify where recovery improvements will have the highest impact.
Future-Proofing Your Payment Recovery Strategy
Emerging Technologies
The payment recovery landscape continues evolving with new technologies:
Account Updater Services Automatically update expired card information before failures occur, preventing involuntary churn proactively.
Real-Time Decision Engines Machine learning models that make split-second routing decisions based on hundreds of data points.
Predictive Failure Detection AI systems that identify customers likely to experience payment failures before they occur, enabling proactive intervention.
Regulatory Considerations
Payment recovery strategies must balance effectiveness with compliance:
- PCI DSS requirements for card data handling
- GDPR implications for customer communication
- Regional regulations on retry attempts
- Consumer protection laws
Ensure your chosen solution maintains SOC 2 Type-II compliance and follows industry best practices. (Slicker)
Conclusion: Turning Hidden Costs into Competitive Advantage
Involuntary churn represents one of the largest hidden revenue leaks in subscription businesses, with the potential to cost companies hundreds of thousands annually. (State of Retention 2025 | Churnkey) However, this challenge also presents a significant opportunity.
By implementing the revenue-loss calculator provided in this article, you can:
- Quantify your exact exposure to involuntary churn
- Model the ROI of recovery improvements
- Justify investment in modern payment recovery solutions
- Track progress and optimize performance over time
The companies that master payment recovery will gain a sustainable competitive advantage. While competitors lose customers to preventable payment failures, businesses with intelligent recovery systems will retain more customers, reduce acquisition costs, and accelerate growth.
Start with the calculator, understand your exposure, and then explore modern solutions that can transform this hidden cost into a revenue driver. The $129 billion involuntary churn problem isn't going away—but your contribution to it can be dramatically reduced with the right approach and tools.
Remember: every 1% improvement in payment recovery translates directly to bottom-line impact. (Slicker) In a world where customer acquisition costs continue rising, retaining the customers you already have through better payment recovery isn't just smart—it's essential for sustainable growth.
Frequently Asked Questions
What is the projected cost of involuntary churn in 2025?
According to the State of Retention 2025 report by Churnkey, involuntary churn is projected to cost subscription companies $129 billion in 2025. This massive revenue leak occurs when loyal customers are lost due to payment failures rather than voluntary cancellations, making it a critical issue for subscription businesses to address.
How much of total churn is caused by involuntary payment failures?
Involuntary churn can comprise up to 40% of a business's total churn according to industry research. Stripe's data shows that involuntary churn makes up 25% of all subscription cancellations, occurring when customers don't want to leave but their payments fail due to expired cards, insufficient funds, or other payment issues.
What are the hidden costs of failed payments beyond lost revenue?
Beyond the immediate revenue loss, failed payments create cascading costs including customer support overhead, payment processing fees for retry attempts, administrative time for manual recovery efforts, and potential damage to customer relationships. These hidden costs can multiply the true impact of payment failures significantly beyond the face value of the lost transaction.
How can AI-powered payment recovery help reduce involuntary churn?
AI-powered solutions like Vindicia Retain can automatically recapture up to 50% of failed transactions using machine learning algorithms. These systems analyze each failing payment individually, optimizing retry timing and methods based on decline reasons such as expired cards, suspicious activity, or insufficient funds to maximize recovery rates.
What percentage of failed payments can typically be recovered?
Modern payment recovery solutions can recover a significant portion of failed payments, with AI-powered platforms achieving recovery rates of up to 50% according to Vindicia. The exact recovery rate depends on factors like the reason for decline, timing of retry attempts, and the sophistication of the recovery system being used.
How do soft declines differ from hard declines in payment failures?
Soft declines are temporary payment issues such as insufficient funds, network glitches, or overzealous bank security flags that can often be resolved with retry attempts. Hard declines typically indicate more permanent issues like expired or cancelled cards that require customer intervention to resolve, making them more challenging to recover automatically.
Sources
- https://churnkey.co/reports/state-of-retention-2025
- https://paymentsplugin.com/blog/failed-recurring-payments-stripe/
- https://usermotion.com/saas-churn-rate-benchmark-2024
- https://vindicia.com/technical-center/faq/vindicia-retain-faq/
- https://www.slickerhq.com/
- https://www.slickerhq.com/blog/comparative-analysis-of-ai-payment-error-resolution-slicker-vs-competitors
- https://www.slickerhq.com/blog/the-hidden-cost-of-failed-payments-beyond-the-lost-revenue
Related Articles
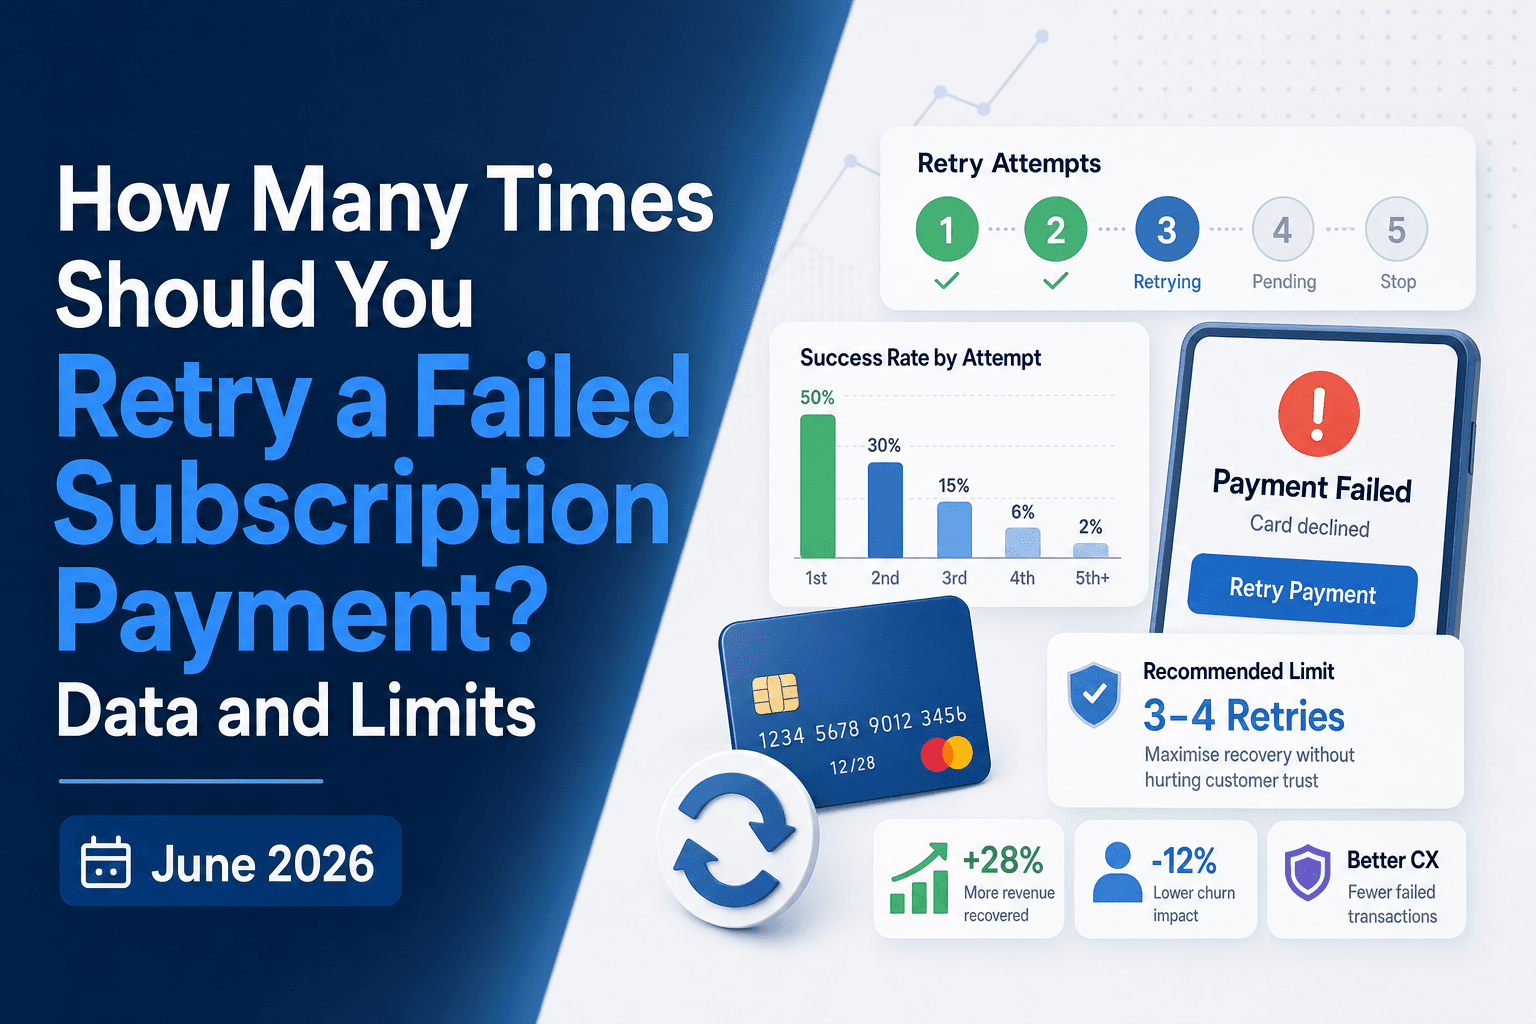
How Many Times Should You Retry a Failed Subscription Payment? Data and Limits (June 2026)
Every failed subscription payment puts you at a fork in the road. Retry it and you might recover the revenue you already earned, or you might burn an attempt...
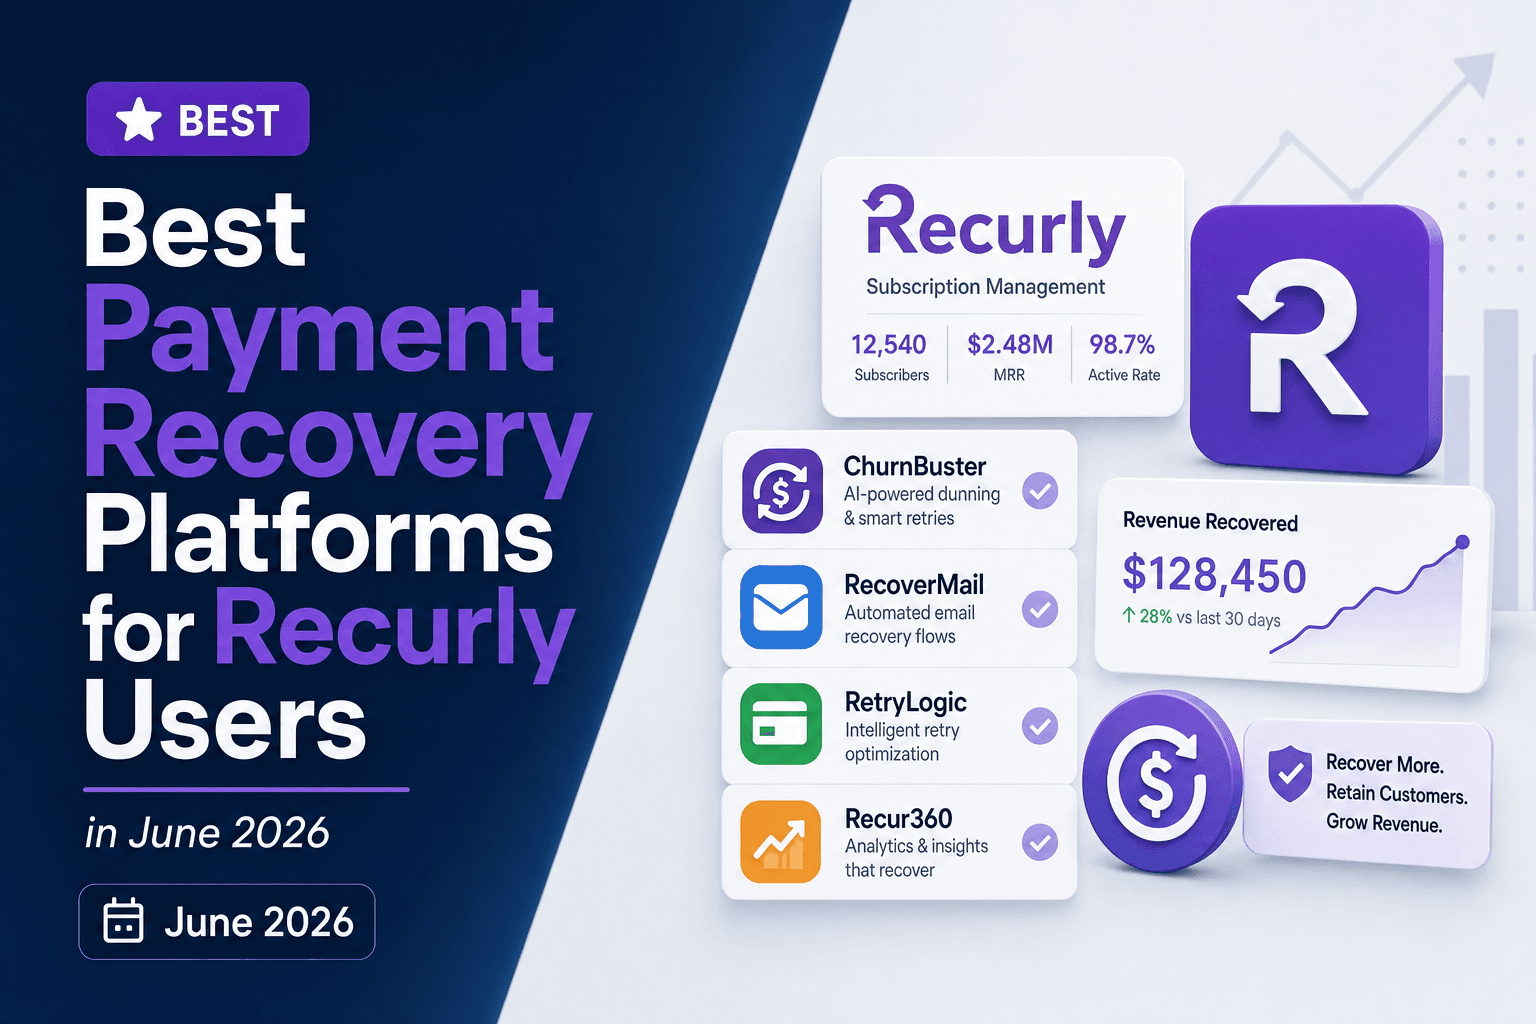
Best Payment Recovery Platforms for Recurly Users in June 2026
If you're using Recurly for subscription billing, you already know its dunning capabilities stop at basic scheduled retries and templated emails. When payment...
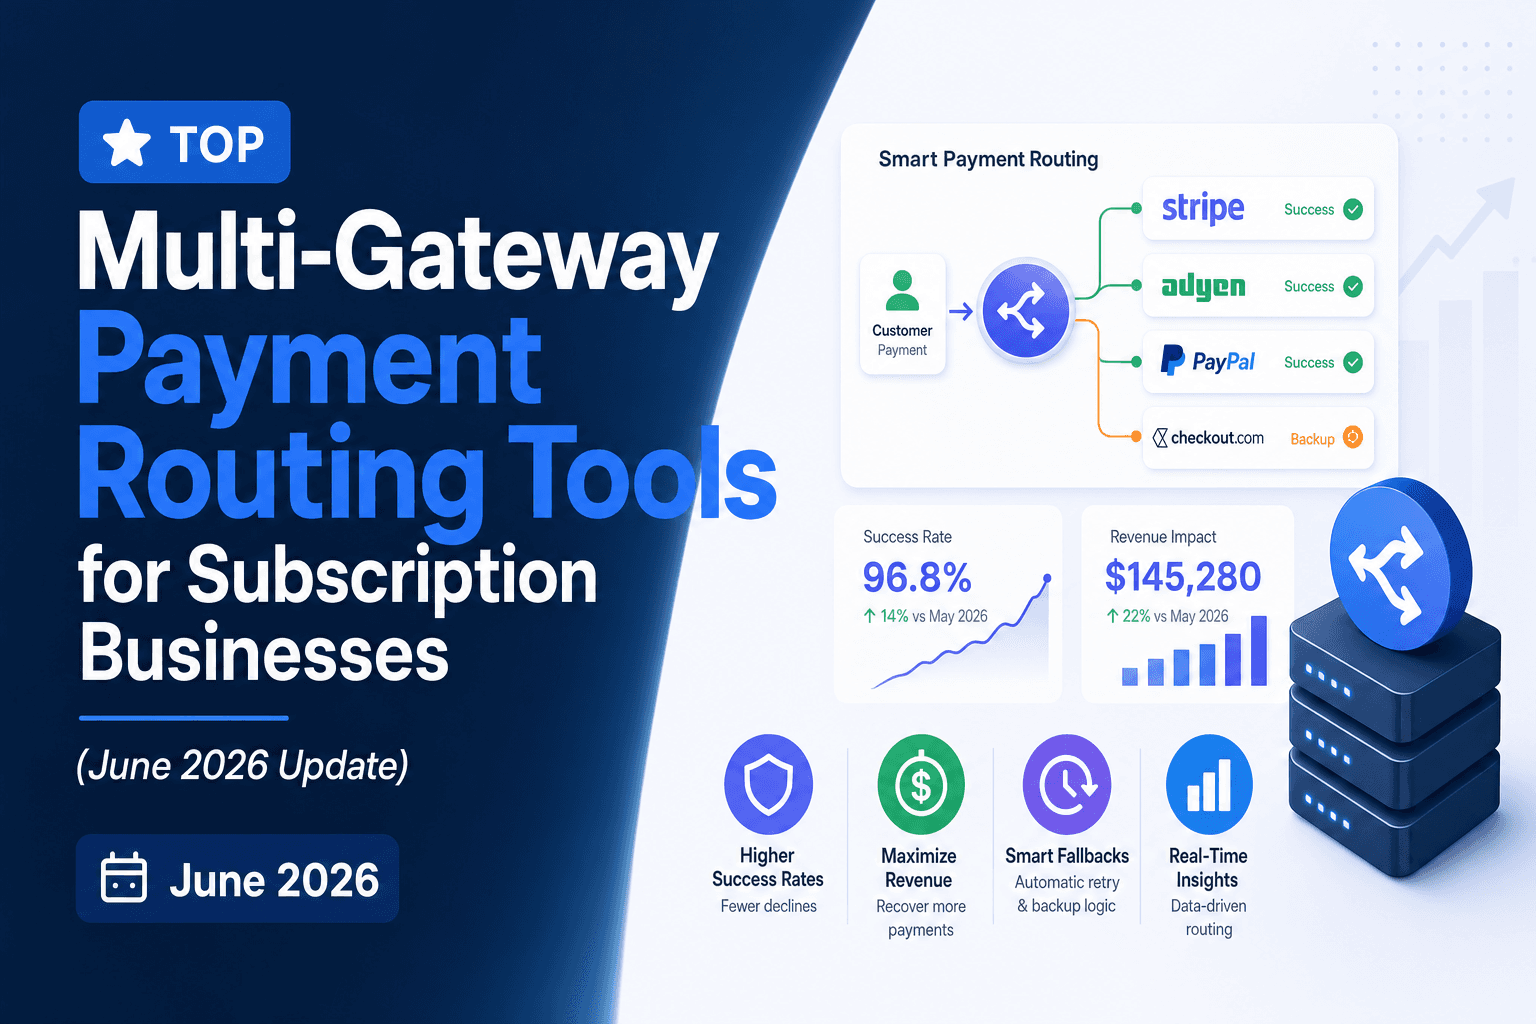
Top Multi-Gateway Payment Routing Tools for Subscription Businesses (June 2026 Update)
Your payment gateway works fine until it doesn't, and when 15% of recurring charges fail, the cost of sticking with a single processor adds up fast....
Stop losing revenue to failed payments
Join leading subscription businesses using Slicker to recover failed payments automatically.
Get Started