How Many Retries for Soft Declines? A Q3 2025 Data-Driven Guide for SaaS CFOs

Introduction
Soft declines are the silent killers of SaaS cash flow. While hard declines signal definitive payment failures, soft declines represent temporary issues—insufficient funds, expired cards, or processing hiccups—that can often be resolved with the right retry strategy. The global subscription industry is projected to reach a market value of $1.5 trillion by 2025, yet subscription companies could lose an estimated $129 billion in 2025 due to involuntary churn, which occurs when a subscription payment stops due to a payment error (Recurly).
The question isn't whether to retry soft declines—it's how many attempts maximize recovery while minimizing chargeback risk and operational overhead. Industry benchmarks show that best-in-class recovery rates hover between 45-60%, but the path to achieving these numbers requires strategic thinking about retry cadences, timing windows, and intelligent routing (Churnkey).
This comprehensive guide examines the ROI of 3, 5, and 7-attempt retry schedules, explores machine learning-driven timing optimization, and provides actionable frameworks for CFOs looking to plug revenue leaks without breaking the bank.
The Hidden Cost of Soft Declines: Why Every Retry Matters
Involuntary churn can easily comprise 40% of a business's churn, with soft and hard credit card declines being primary contributors (Churnkey). Unlike voluntary churn, where customers actively decide to cancel, involuntary churn represents lost revenue from customers who never intended to leave.
The math is sobering: there are over 2,000 things that can go wrong when a credit card is processed for a transaction (Recurly). High credit card decline rates lead to involuntary churn, causing loss of subscribers and revenue, making an effective decline management strategy essential to reduce the risk of high involuntary churn rates.
The Batch Processing Problem
Most legacy billing systems treat all failed payments identically, applying the same retry logic regardless of decline reason, customer history, or payment context. This "one-size-fits-all" approach is fundamentally flawed. Batch processing is the equivalent of fishing with dynamite when precision angling tools are readily available (Slicker).
Batch systems typically apply identical retry logic to all failed payments, missing critical nuances that could dramatically improve success rates (Slicker). Optimal retry timing can vary dramatically based on decline reason, customer payment history, and even the day of the month.
Industry Benchmarks: What "Good" Recovery Looks Like
Recovery Rate Expectations by Retry Attempt
| Retry Attempt | Industry Average Recovery | Best-in-Class Recovery | Cumulative Success Rate |
|---|---|---|---|
| 1st Retry | 15-25% | 30-40% | 15-25% |
| 2nd Retry | 8-12% | 15-20% | 23-37% |
| 3rd Retry | 5-8% | 10-15% | 28-45% |
| 4th Retry | 3-5% | 8-12% | 31-57% |
| 5th Retry | 2-3% | 5-8% | 33-65% |
| 6th+ Retries | 1-2% | 3-5% | 34-70% |
These benchmarks reveal a clear pattern: the first retry captures the majority of recoverable revenue, with diminishing returns on subsequent attempts. However, companies that switch from batch-based to intelligent, individualized retry strategies typically see a 20-50% increase in recovered revenue (Slicker).
The 70% Recovery Ceiling
Churnkey's research indicates that overall recoverability can reach 70% with sophisticated retry strategies, but this requires moving beyond simple retry counts to intelligent timing and routing (Churnkey). The key insight: not all soft declines are created equal, and treating them uniformly leaves money on the table.
The ROI Analysis: 3 vs 5 vs 7 Retry Attempts
Scenario Modeling: Mid-Market SaaS Company
Let's model a typical mid-market SaaS company with the following characteristics:
- Monthly Recurring Revenue (MRR): $500,000
- Monthly decline rate: 8%
- Average revenue per user (ARPU): $150
- Soft decline percentage: 65% of all declines
Monthly soft decline volume: $500,000 × 8% × 65% = $26,000 in at-risk MRR
3-Retry Strategy
| Retry | Success Rate | Recovered Revenue | Cumulative Recovery |
|---|---|---|---|
| 1st | 20% | $5,200 | $5,200 |
| 2nd | 10% | $2,080 | $7,280 |
| 3rd | 6% | $1,123 | $8,403 |
Total Recovery: $8,403 (32.3% of at-risk MRR) Annual Impact: $100,836
5-Retry Strategy
| Retry | Success Rate | Recovered Revenue | Cumulative Recovery |
|---|---|---|---|
| 1st | 20% | $5,200 | $5,200 |
| 2nd | 10% | $2,080 | $7,280 |
| 3rd | 6% | $1,123 | $8,403 |
| 4th | 4% | $707 | $9,110 |
| 5th | 3% | $506 | $9,616 |
Total Recovery: $9,616 (37.0% of at-risk MRR) Annual Impact: $115,392 Incremental Gain vs 3-Retry: $14,556 annually
7-Retry Strategy
| Retry | Success Rate | Recovered Revenue | Cumulative Recovery |
|---|---|---|---|
| 1st | 20% | $5,200 | $5,200 |
| 2nd | 10% | $2,080 | $7,280 |
| 3rd | 6% | $1,123 | $8,403 |
| 4th | 4% | $707 | $9,110 |
| 5th | 3% | $506 | $9,616 |
| 6th | 2% | $323 | $9,939 |
| 7th | 1.5% | $230 | $10,169 |
Total Recovery: $10,169 (39.1% of at-risk MRR) Annual Impact: $122,028 Incremental Gain vs 5-Retry: $6,636 annually
The Diminishing Returns Reality
The data clearly shows diminishing returns beyond the 5th retry attempt. While the 7-retry strategy recovers an additional $6,636 annually, this must be weighed against increased operational complexity, potential chargeback risk, and customer experience considerations.
Machine Learning-Driven Retry Optimization
Beyond Static Retry Schedules
Traditional retry strategies use fixed intervals—retry after 3 days, then 7 days, then 14 days. However, machine learning engines predict the perfect moment, method, and gateway for each retry, lifting recovery rates 2-4× above native billing logic (Slicker).
AI in payment systems can reduce fraud losses by up to 40% by detecting fraud in real time, while also providing a more personalized payment experience, resulting in a 20% increase in customer retention rate (Medium).
Recurly's ML-Chosen Windows
Recurly's machine learning algorithms analyze historical payment patterns to determine optimal retry timing. Rather than using fixed intervals, the system considers factors like:
- Customer payment history
- Decline reason codes
- Day of month and week patterns
- Geographic and demographic factors
- Card type and issuer characteristics
This intelligent approach can significantly improve recovery rates compared to static retry schedules (Recurly).
Dynamic Routing: The Next Frontier
Smart Routing allows merchants to automatically select the best gateway for the situation depending on the purchaser's card, geography, and other factors (Spreedly). Dynamic Retries represent a significant leap forward because the system evaluates nuances in real time, ensuring higher accuracy and success.
Spreedly's platform analyzes performance for all transactions in a trailing 4-hour window, with plans to get closer to real-time in the future, choosing the best gateway to route transactions to based on card criteria such as Brand/scheme/logo, type, BIN, and country (Spreedly).
The Chargeback Risk Factor
When Retries Become Counterproductive
While aggressive retry strategies can boost recovery rates, they also increase chargeback risk. Excessive retry attempts, particularly on cards that have been flagged by issuers, can trigger chargeback disputes that cost far more than the original transaction value.
Risk Mitigation Strategies
-
Decline Code Intelligence: Different decline codes warrant different retry strategies. "Insufficient funds" might justify 5-7 attempts over 30 days, while "card reported stolen" should trigger immediate cessation.
-
Customer Communication: Proactive communication about payment issues can reduce chargebacks and improve customer experience. Automated emails explaining the retry process and offering alternative payment methods can prevent disputes.
-
Velocity Controls: Implementing daily and weekly retry limits prevents excessive attempts that could trigger issuer blocks or customer complaints.
Building Your Retry Strategy: A Framework for CFOs
Step 1: Audit Your Current Performance
Before optimizing retry counts, establish baseline metrics:
- Current decline rate by payment method
- Recovery rate by retry attempt
- Time to recovery for successful retries
- Chargeback rate correlation with retry frequency
Step 2: Segment by Decline Reason
Not all soft declines should follow the same retry schedule:
| Decline Reason | Recommended Retries | Timing Strategy |
|---|---|---|
| Insufficient Funds | 5-7 attempts | 3, 7, 14, 21, 30 days |
| Expired Card | 2-3 attempts | 1, 3, 7 days |
| Processing Error | 3-5 attempts | 1, 2, 5, 10 days |
| Issuer Decline | 2-4 attempts | 2, 7, 14 days |
| Card Limit Exceeded | 4-6 attempts | 3, 7, 15, 22, 30 days |
Step 3: Implement Intelligent Timing
Optimal retry timing can vary dramatically based on decline reason, customer payment history, and even the day of the month (Slicker). Consider these timing factors:
- Payday Patterns: Retry insufficient funds declines around typical payday cycles (1st, 15th, 30th of month)
- Weekend Avoidance: Avoid retries on weekends when customer service is unavailable
- Time Zone Optimization: Schedule retries during business hours in the customer's time zone
Step 4: Layer in Smart Routing
Payment routing is the process of selecting the optimal path for a payment to travel through the financial system, ensuring payments are processed quickly, securely, and at the lowest possible cost (HubiFi). For retry attempts, this means:
- Testing alternative payment gateways for failed transactions
- Routing to gateways with higher success rates for specific card types
- Implementing failover logic when primary gateways are experiencing issues
Technology Solutions: Build vs Buy
Native Billing Platform Capabilities
Most billing platforms offer basic retry functionality, but capabilities vary significantly:
- Stripe: Offers Smart Retries with machine learning optimization
- Chargebee: Provides dunning management with automatic card updater services that recover up to 20% more invoices before a retry is even needed
- Recurly: Features advanced retry logic with ML-driven timing optimization
- Zuora: Includes configurable retry schedules and decline code handling
Specialized Payment Recovery Platforms
For companies seeking best-in-class recovery rates, specialized platforms offer advanced capabilities. Slicker's AI-powered payment-recovery platform automatically monitors, detects and recovers failed subscription payments to reduce involuntary churn, with its proprietary machine-learning engine evaluating each failed transaction, scheduling intelligent retries and routing payments across multiple gateways (Slicker).
Slicker delivers 2-4× better recovery than native billing-provider logic, supports Stripe, Chargebee, Recurly, Zuora and Recharge, and offers a pay-for-success pricing model with 5-minute setup and no code changes required (Slicker).
Implementation Roadmap: 90-Day Action Plan
Days 1-30: Assessment and Planning
- Data Collection: Export 6 months of payment decline data
- Baseline Establishment: Calculate current recovery rates by retry attempt
- Segmentation Analysis: Group declines by reason code and customer characteristics
- Technology Audit: Assess current billing platform retry capabilities
Days 31-60: Strategy Development
- Retry Schedule Design: Create decline-reason-specific retry schedules
- Timing Optimization: Implement intelligent timing based on customer patterns
- Communication Templates: Develop customer-facing messaging for retry attempts
- Success Metrics: Define KPIs for measuring improvement
Days 61-90: Implementation and Testing
- Phased Rollout: Implement new retry logic for 25% of customers
- A/B Testing: Compare new strategy against existing approach
- Performance Monitoring: Track recovery rates, chargeback rates, and customer satisfaction
- Optimization: Refine retry schedules based on initial results
Measuring Success: KPIs That Matter
Primary Metrics
- Recovery Rate: Percentage of soft declines successfully recovered
- Time to Recovery: Average days from initial decline to successful payment
- Incremental MRR: Additional monthly recurring revenue from improved retry strategy
- Customer Retention: Percentage of customers retained through successful recovery
Secondary Metrics
- Chargeback Rate: Disputes per 1,000 retry attempts
- Customer Satisfaction: Support ticket volume related to payment issues
- Operational Efficiency: Staff time spent on manual payment recovery
- Cost per Recovery: Total program cost divided by successful recoveries
Future-Proofing Your Retry Strategy
Emerging Trends in Payment Recovery
The payments landscape continues evolving rapidly. Global digital payments are projected to reach $15.3 trillion by 2027, while AI in banking is expected to create $1 trillion in value annually (LinkedIn).
Generative AI has transformed from a buzzword into a tangible threat, with 42% of scams now being AI driven, requiring more sophisticated fraud detection and prevention measures (Sardine).
Preparing for Regulatory Changes
Cross-border payments still take an average of 2-5 days to settle, causing the global economy to lose $120 billion annually to payment friction (LinkedIn). As regulations evolve to address these inefficiencies, retry strategies must adapt to new compliance requirements.
Conclusion: The Strategic Imperative
The question of how many retries to schedule for soft declines doesn't have a one-size-fits-all answer. However, the data clearly shows that:
- 5 retries represent the sweet spot for most SaaS companies, balancing recovery potential with operational complexity
- Intelligent timing beats fixed schedules by 20-50% in recovery performance
- Decline-reason segmentation is essential for optimizing retry strategies
- Technology investment pays dividends through automated, ML-driven optimization
In the subscription economy, failed payments represent a critical revenue leak that businesses can't afford to ignore (Slicker). With subscription companies potentially losing $129 billion in 2025 due to involuntary churn, the cost of inaction far exceeds the investment in sophisticated retry strategies (Recurly).
CFOs who implement data-driven retry strategies today will capture incremental MRR while their competitors continue losing customers to preventable payment failures. The tools and techniques outlined in this guide provide a roadmap for transforming payment recovery from a reactive cost center into a proactive revenue driver.
The future belongs to companies that treat payment recovery as a strategic capability, not an operational afterthought. Start with your current data, implement intelligent retry logic, and watch as recovered revenue flows directly to your bottom line.
Frequently Asked Questions
What is the optimal number of retry attempts for soft declines in SaaS?
Industry data suggests 3-7 retry attempts provide the best balance between recovery rates and operational costs. A 5-attempt cadence typically recovers 60-70% of soft declines while minimizing chargeback risk. The exact number depends on your customer base, payment methods, and risk tolerance.
How much revenue can SaaS companies lose from failed payment retries?
Subscription companies could lose an estimated $129 billion in 2025 due to involuntary churn from payment failures. With the global subscription industry projected to reach $1.5 trillion by 2025, optimizing retry strategies is critical for maintaining cash flow and reducing customer churn.
What role does AI play in optimizing payment retry strategies?
AI revolutionizes payment processing by improving retry timing and success rates. AI-driven systems can reduce fraud losses by up to 40% and increase customer retention by 20% through personalized payment experiences. Machine learning algorithms analyze payment patterns to optimize retry cadences for maximum recovery.
How can batch payment retries hurt SaaS recovery rates?
One-size-fits-all batch payment retries ignore customer-specific payment patterns and optimal timing windows. Personalized retry strategies that consider individual customer behavior, payment history, and transaction context significantly outperform generic batch approaches in recovering failed payments.
What percentage of SaaS churn is involuntary vs voluntary?
Involuntary churn can easily comprise 40% of a business's total churn, including both soft and hard credit card declines. This represents a massive opportunity for SaaS companies to recover revenue through optimized retry strategies rather than focusing solely on voluntary churn reduction.
How do smart payment routing and retry strategies work together?
Smart payment routing selects the optimal payment gateway based on card type, geography, and performance data, while retry strategies determine timing and frequency. Together, they can significantly improve authorization rates by routing failed payments to alternative processors and retrying at optimal intervals.
Sources
- https://churnkey.co/reports/state-of-retention-2025
- https://medium.com/@martareyessuarez25/artificial-intelligence-revolutionizes-payment-processing-0e7b0b2e62f5
- https://recurly.com/press/failed-payments-could-cost-subscription-companies-more-than-129-billion-in-2025-us/
- https://recurly.com/research/subscription-benchmarks-top-payment-decline-reasons/
- https://recurly.com/resources/tools/recovered-revenue-calculator/
- https://www.hubifi.com/blog/payment-routing-guide
- https://www.linkedin.com/pulse/intelligence-revolution-reaimagining-payments-2030-sumit-arora-ppsvc
- https://www.sardine.ai/blog/2025-fraud-compliance-predictions
- https://www.slickerhq.com/blog/comparative-analysis-of-ai-payment-error-resolution-slicker-vs-competitors
- https://www.slickerhq.com/blog/how-to-implement-ai-powered-payment-recovery-to-mi-00819b74
- https://www.slickerhq.com/blog/one-size-fails-all-the-case-against-batch-payment-retries
- https://www.spreedly.com/blog/improving-success-rates-true-dynamic-routing
- https://www.spreedly.com/blog/we-got-the-digital-goods-smart-routing-case-study
Related Articles
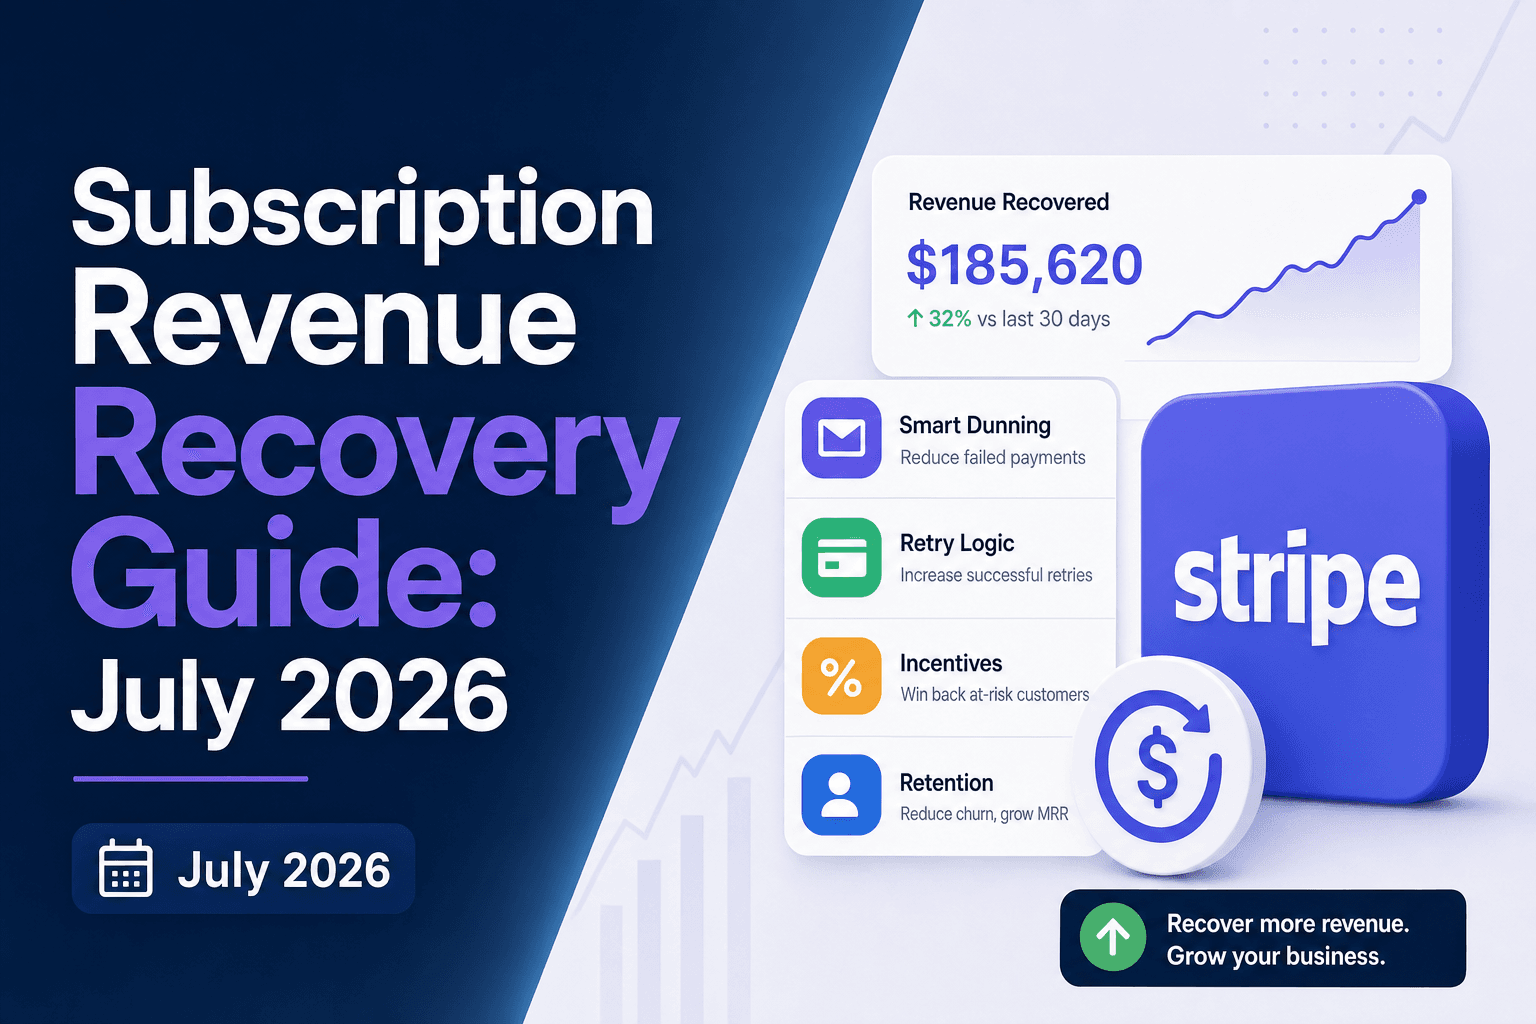
Subscription Revenue Recovery Guide: July 2026
When was the last time you actually calculated how much revenue your business loses to failed payments before a single customer actively cancels? For most...
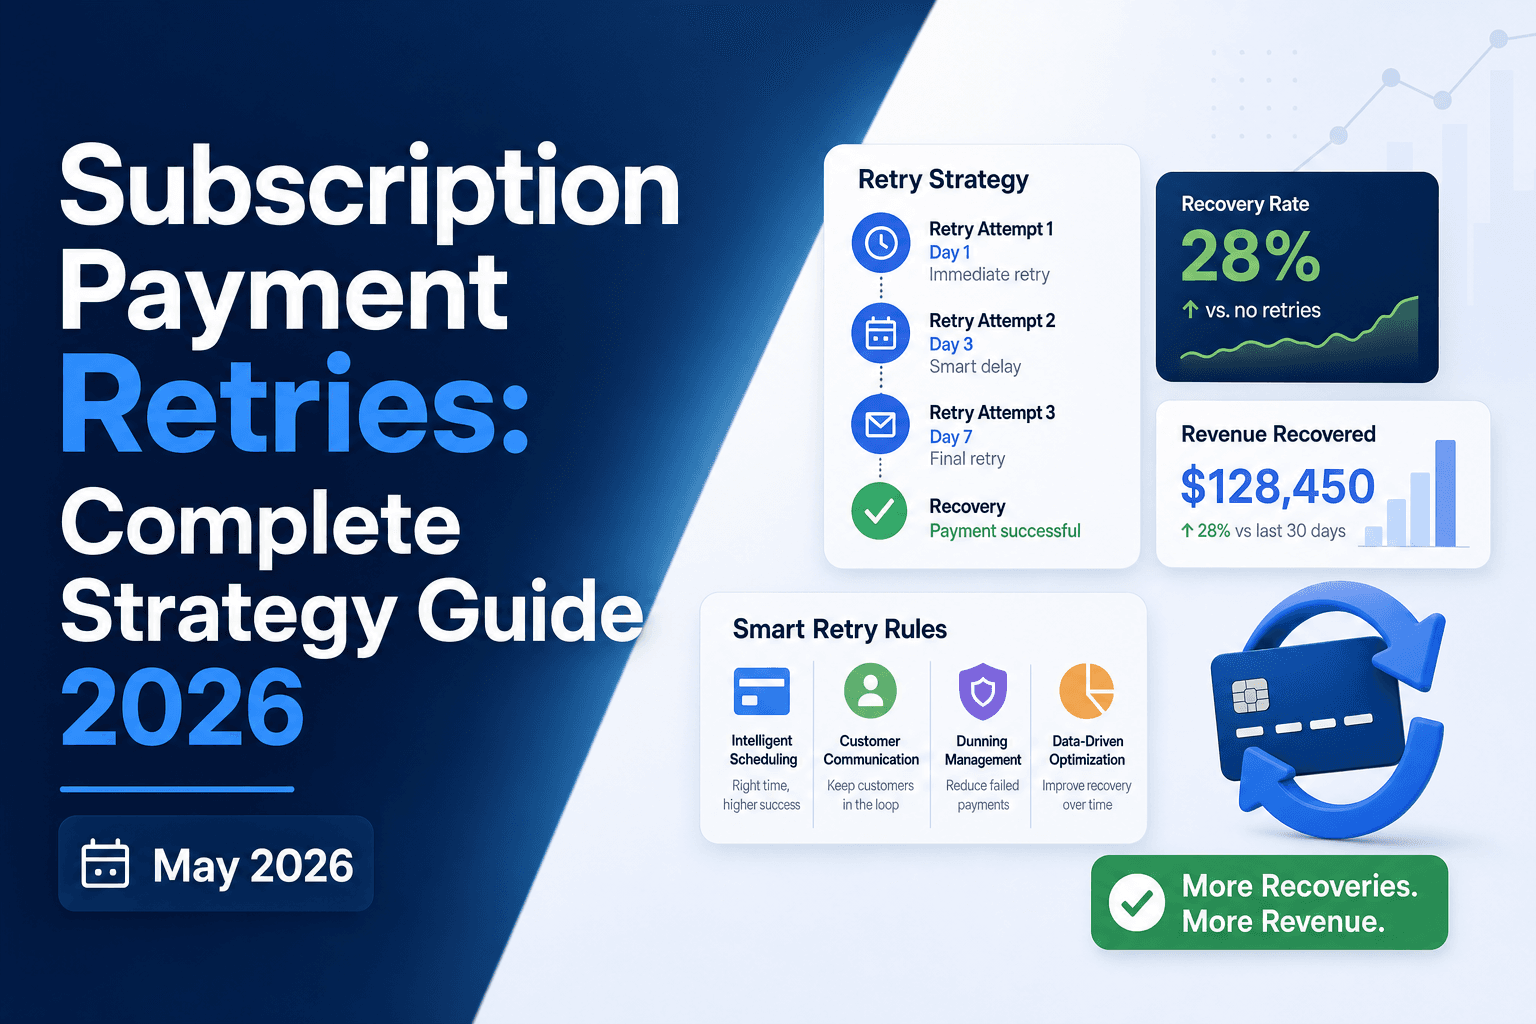
Subscription Payment Retries: Complete Strategy Guide 2026
Stripe smart retries can handle the basics, but if you're running a high-volume subscription business and wondering why your Stripe retry setup still leaves...
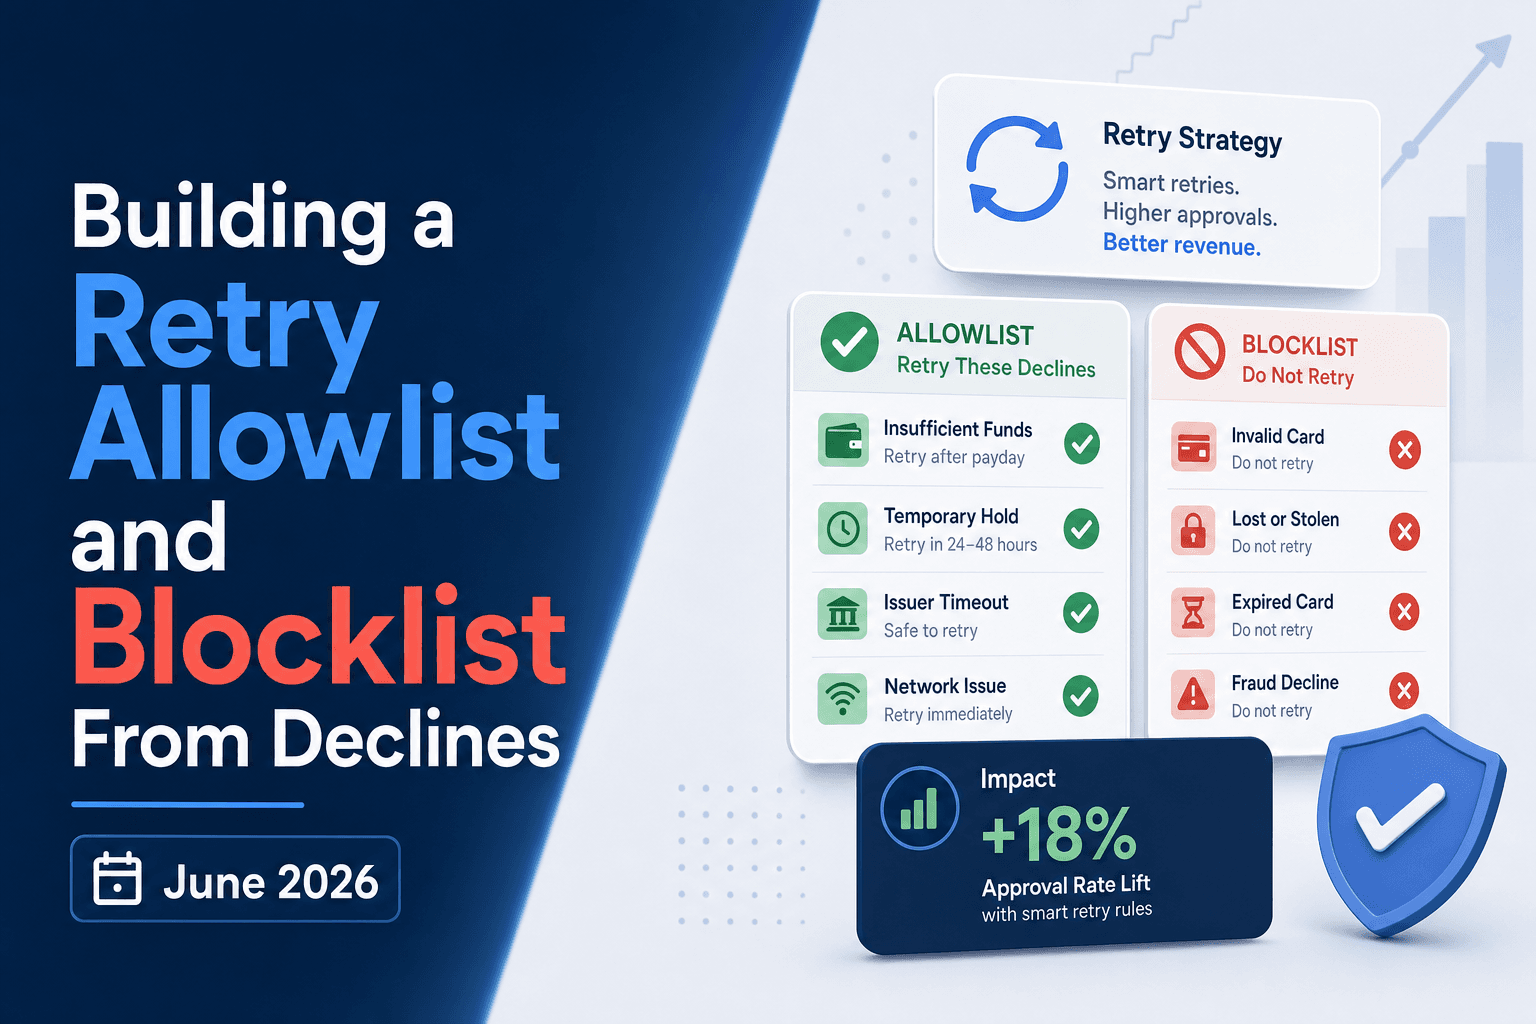
How to Build a Retry Allowlist and Blocklist From Declines (July 2026)
I'll be frank: most retry logic is built on assumptions, not data. A retry allowlist tells your system when to try again; a payment retry blocklist tells it...
Stop losing revenue to failed payments
Join leading subscription businesses using Slicker to recover failed payments automatically.
Get Started