Can smart payment retries reach 90% recovery? Reality check

Smart payment retry systems typically achieve 45-60% recovery rates for failed subscription payments, with advanced AI solutions reaching up to 70% for soft declines specifically. Claims of 90% recovery ignore card network retry limits and the reality that many declines are permanent. The most sophisticated engines deliver 20-50% increases over basic retry logic.
Reality Check: Key Facts
• Actual recovery ceiling: Best-in-class systems achieve 45-60% blended recovery across all decline types
• Network constraints: Visa and Mastercard limit merchants to around 15 retry attempts in 30 days, capping aggressive recovery strategies
• Revenue at stake: Failed payments cost subscription businesses an estimated $129 billion in 2025 through involuntary churn
• Vendor reality: FlexPay case studies show 25-52% recovery rates, far below marketed 90% claims
• Soft decline potential: AI optimization can push soft decline recovery toward 70%, but hard declines remain unrecoverable
• Practical uplift: Companies switching to intelligent retry strategies see 20-50% revenue recovery increases over basic systems
Subscription CFOs keep hearing that smart payment retries can claw back 90% of failed charges. The promise is tantalizing: deploy an AI retry engine and watch nearly every declined transaction convert to revenue. This post dissects that headline, shows what the card network math actually allows, and maps credible targets for smart payment retries.
The 90% recovery promise: where did it come from?
In the subscription economy, failed payments represent a critical revenue leak that businesses cannot afford to ignore. When vendors began marketing AI-powered retry solutions, bold recovery claims became a competitive differentiator.
The stakes are enormous. Industry research shows that 10-15% of subscription revenue disappears annually due to payment failures such as expired cards and insufficient funds. Meanwhile, subscription companies could lose an estimated $129 billion in 2025 due to involuntary churn.
With numbers this large, it is no surprise vendors compete on recovery percentages. A 90% headline grabs attention in a market where every percentage point matters. But as we will see, that figure does not survive contact with operational reality.
Key takeaway: The 90% figure emerged as marketing shorthand in a high-stakes market, but it conflates best-case scenarios with typical performance.
What do industry benchmarks really say about recovery ceilings?
Published benchmarks paint a more measured picture than vendor headlines suggest.
| Source | Recovery Rate | Context |
|---|---|---|
| Industry benchmarks (best-in-class) | 45-60% | Across all decline types with strategic retry cadences |
| Beast Insights (smart recovery) | Up to 70% | Optimal timing and intelligent routing |
| Recurring payment failure rate | 15-30% | High-risk merchants at upper end |
These figures align around a consistent ceiling. "Industry benchmarks show that best-in-class recovery rates hover between 45-60%," notes analysis from Slicker's CFO guide. Reaching those numbers requires strategic thinking about retry cadences, timing windows, and intelligent routing.
The 70% figure from Beast Insights represents an upper bound achievable only with sophisticated strategies applied specifically to soft declines. It is not a blended rate across all failure types.

Why is 90% mathematically out of reach?
Three structural barriers prevent recovery rates from approaching 90%:
1. Card network retry limits
Visa and Mastercard limit merchants to around 15 attempts in 30 days. Exceed that threshold and you risk fines or being flagged as a bad actor. These compliance constraints cap how aggressively any system can pursue recovery.
2. Hard declines are irrecoverable
There are over 2,000 things that can go wrong when a credit card is processed. Many result in hard declines: stolen cards, closed accounts, or fraud flags that no amount of retrying will overcome. Smart recovery strategies focus exclusively on soft declines, the pool of transactions you can actually win back.
3. Diminishing returns after first retry
The first retry captures the majority of recoverable revenue, with diminishing returns on subsequent attempts. The math simply does not support 90% when a substantial portion of failures are permanent from the start.
Reality-checking vendor marketing: FlexPay, GoCardless & Vindicia
Vendor claims deserve scrutiny against actual case study data.
FlexPay case studies show 25-52% recovery, not 90%
FlexPay positions itself as an enterprise-grade solution with machine learning models trained on a dataset "equaling 7% of all US annual transactions." The scale is impressive. But what do customers actually achieve?
- Persist Brands reports a 25-35% payment recovery rate with FlexPay
- Community.co achieved up to 52% recovery on failed payments
These are solid results. They are also well below 90%.
GoCardless Success+: 76% recovery, but only on direct debit rails
GoCardless claims customers can recover up to 76% of failed payments with Success+. This headline requires context.
GoCardless Success+ leverages deep expertise in ACH and SEPA payment recovery, which are direct debit rails. Direct debit operates differently from card networks: failures often stem from insufficient funds rather than fraud or expired credentials, making them more recoverable.
For businesses primarily processing card transactions, 76% is not an apples-to-apples benchmark.
Vindicia Retain's 50% promise: terminal vs. soft declines
Vindicia Retain claims to automatically resolve up to 50% of terminally failed card transactions. Note the qualifier: "terminally failed" refers to a specific subset of transactions that have already exhausted other recovery options.
This is an important distinction. Vindicia's 50% applies to a filtered pool, not the total universe of payment failures a subscription business experiences.
What do best-in-class smart retries actually deliver (45-70%)?
Realistic expectations align with the data.
- Blended recovery across all declines: 45-60%
- Soft decline recovery with AI optimization: Up to 70%
- Immediate multi-gateway recovery: About 8% of failures recovered by trying alternate processors
Five retries represent the sweet spot for most SaaS companies, balancing recovery potential with operational complexity. Beyond that, returns diminish rapidly.
Companies that switch from batch-based to intelligent, individualized retry strategies typically see: "20-50% increase in recovered revenue." That lift is substantial and achievable. It is also grounded in what the payment ecosystem allows.
How Slicker drives sustainable uplift without the hype
Slicker takes a different approach to recovery claims. Rather than headline percentages, the focus is on measurable improvement over existing systems.
Slicker customers typically see between a 10 and 20 percentage point increase in the number of recovered payments. The platform's proprietary AI engine processes each failing payment individually and schedules intelligent, data-backed retries rather than blindly following generic decline code rules.
Key differentiators include:
- Multi-gateway routing: Automatically selects the best payment gateway when a recurring payment fails
- Pay-for-success pricing: Charges only for successfully recovered payments
- 5-minute setup: Available directly through the Stripe App Marketplace
This model aligns incentives: you pay for results, not promises.

Questions to ask any vendor promising "near-perfect" recovery
Before signing with any AI retry engine, demand clarity on these points:
-
What decline types does your headline rate include? Soft declines only, or blended across all failure categories?
-
How do you handle card network compliance? Stripe recommends a default setting of 8 tries within 2 weeks. How does the vendor stay within Visa and Mastercard limits?
-
What is the typical lift over native billing logic? Multi-gateway approaches immediately recover about 8% of failures by trying alternate processors. What incremental value does the AI add?
-
Can you share case studies with specific metrics? Demand numbers, not testimonials. Ask for customer names you can verify.
-
What is the pricing model? Pay-per-recovery aligns incentives. Flat fees may not.
-
How does recovery impact customer experience? Every 1% lift in recovery can translate into tens of thousands in annual revenue. But aggressive retries can also frustrate customers.
Takeaway: aim for credible, compounding gains, not fairy tales
90% recovery is not happening. The math does not work. Card networks cap retry attempts. Hard declines cannot be recovered. Diminishing returns kick in after the first few attempts.
What is achievable is still valuable. Companies that move from batch retries to intelligent, individualized strategies typically see 20-50% increases in recovered revenue. Best-in-class engines push soft decline recovery toward 70%. Multi-gateway routing captures incremental gains immediately.
These improvements compound. A 10 percentage point lift in recovery, sustained quarter after quarter, translates to meaningful revenue and reduced involuntary churn.
The vendors making realistic claims, backed by transparent case studies and aligned pricing models, are the ones worth evaluating. Slicker's pay-for-success approach exemplifies this philosophy: results matter more than headlines.
For subscription businesses serious about payment recovery, the goal is not chasing mythical 90% rates. It is building a systematic, compliant, and continuously improving recovery capability that delivers measurable gains every month.
Frequently Asked Questions
What is the origin of the 90% recovery claim in smart payment retries?
The 90% recovery claim emerged as a marketing tactic in the competitive landscape of AI-powered retry solutions. It represents an idealized scenario rather than typical performance, often conflating best-case outcomes with average results.
What are the realistic recovery rates for smart payment retries?
Industry benchmarks suggest that best-in-class recovery rates range from 45-60% across all decline types, with up to 70% achievable for soft declines using sophisticated strategies. These figures are more realistic than the 90% claims.
Why is a 90% recovery rate considered unrealistic?
A 90% recovery rate is unrealistic due to structural barriers such as card network retry limits, the irrecoverability of hard declines, and diminishing returns after initial retries. These factors prevent recovery rates from approaching such high levels.
How does Slicker approach payment recovery differently?
Slicker focuses on measurable improvements over existing systems rather than headline percentages. Their AI engine processes each failing payment individually, scheduling intelligent retries and offering a pay-for-success pricing model, which aligns incentives with results.
What should businesses consider when evaluating AI retry vendors?
Businesses should ask vendors about the types of declines included in their recovery rates, compliance with card network limits, typical lift over native billing logic, specific case study metrics, pricing models, and the impact on customer experience.
Sources
- https://beastinsights.com/blog/failed-payment-recovery/
- https://www.slickerhq.com/blog/comparative-analysis-of-ai-payment-error-resolution-slicker-vs-competitors
- https://www.slickerhq.com/blog/soft-decline-retry-strategies-saas-cfos-q3-2025-guide
- https://www.slickerhq.com/blog/top-7-ai-retry-engines-2025-yc-backed-slicker-flexpay-gocardless
- https://flexpay.io/case-studies/persist-brands/
- https://flexpay.io/case-studies/community-co/
- https://gocardless.com/guides/posts/payment-failures/
- https://vindicia.com/resources/datasheets/vindicia-retain-failed-payment-recovery-success-rates/
- https://www.slickerhq.com/
- https://www.slickerhq.com/blog/slicker-is-now-live-on-the-stripe-app-marketplace
- https://stripe.com/docs/billing/revenue-recovery/smart-retries
- https://www.slickerhq.com/pricing
Related Articles
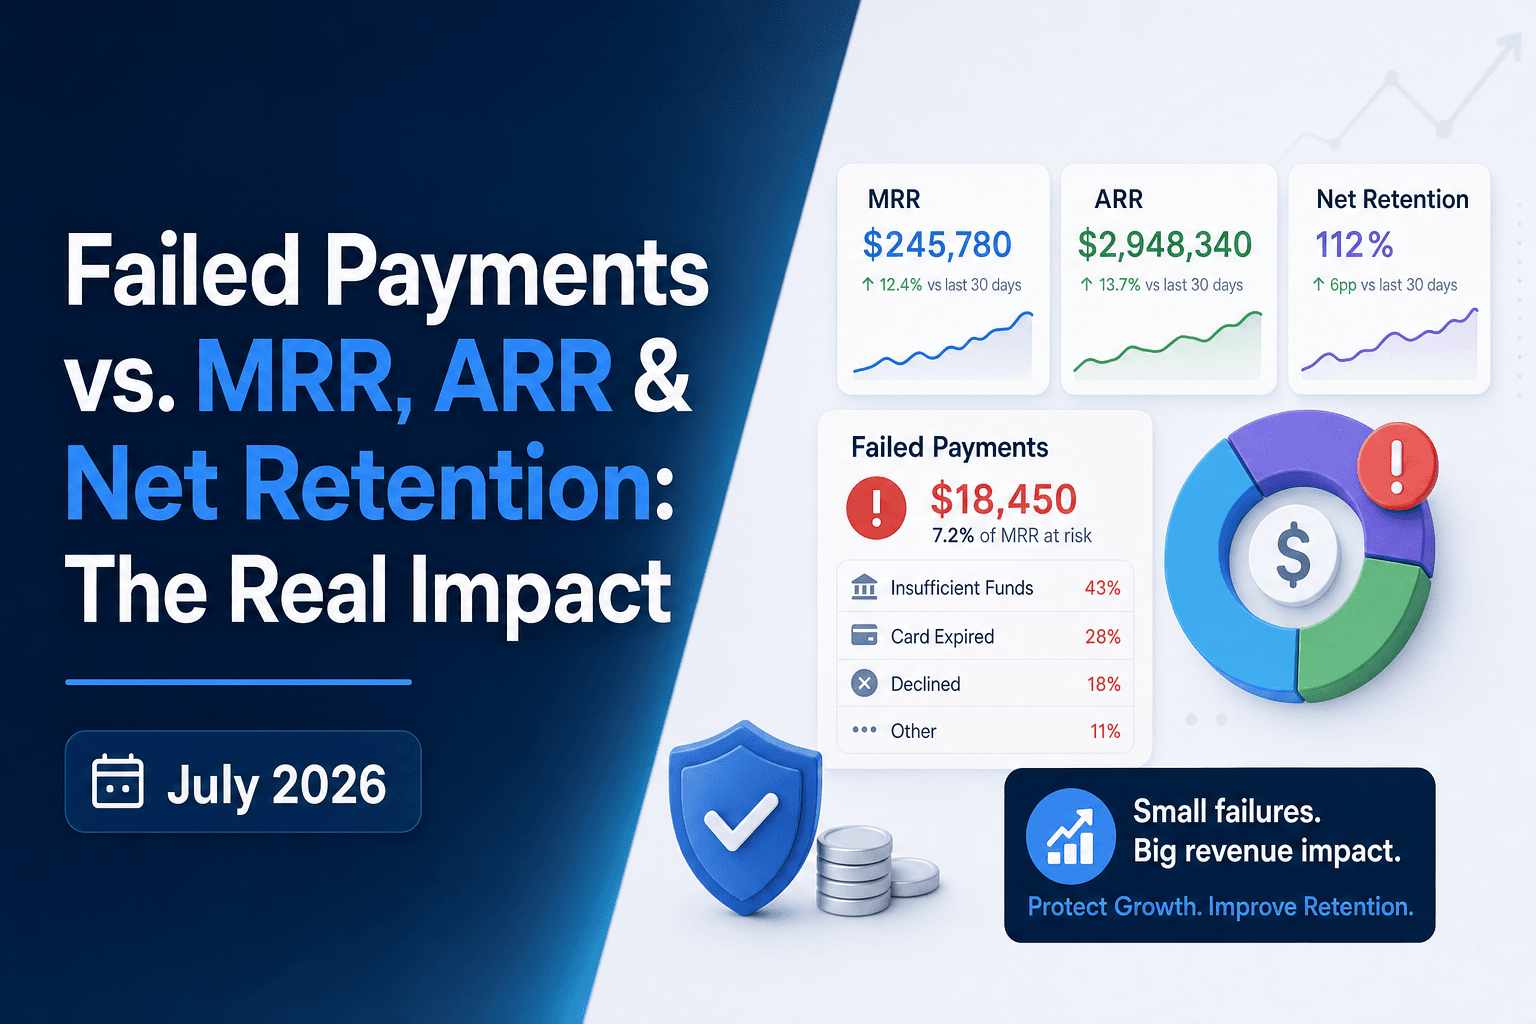
Failed Payments vs. MRR, ARR & Net Retention: The Real Impact (July 2026)
I'll be frank: failed payments MRR is one of the most consistently misread numbers in subscription finance. The subscriber hasn't cancelled, so the revenue...
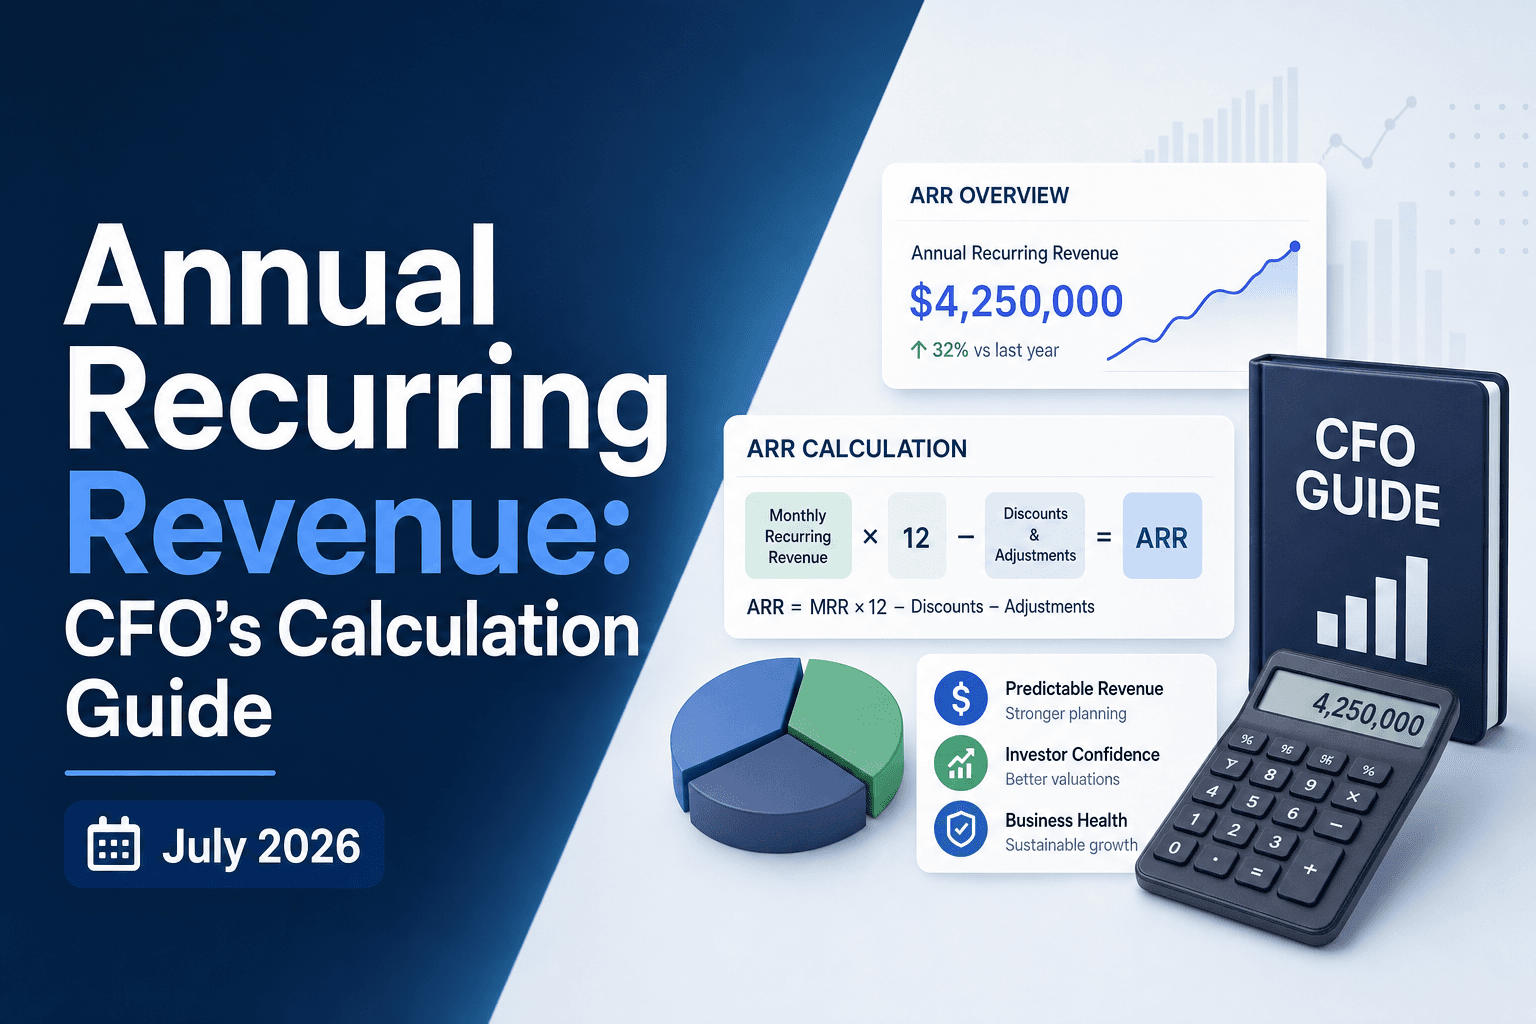
Annual Recurring Revenue: CFO's Calculation Guide July 2026
When a CFO says ARR and an investor hears annual run rate, the same business can look 20% bigger or smaller depending on whose definition wins. Annual...
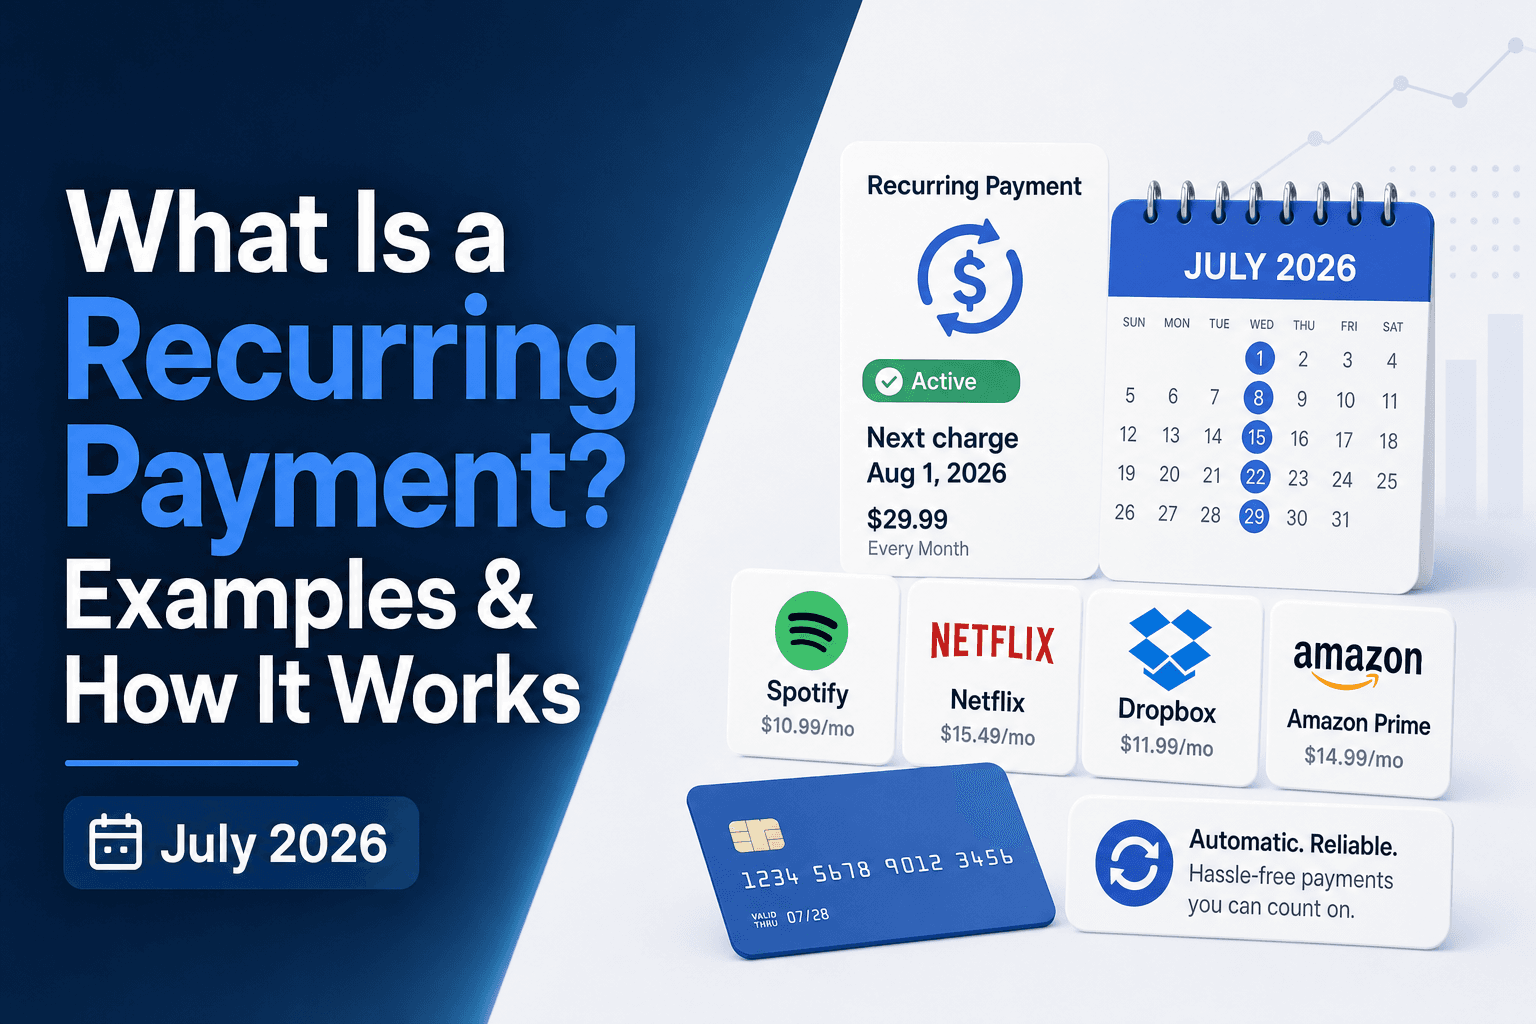
What Is a Recurring Payment? Examples & How It Works (July 2026)
Most of us have more recurring payments running in the background than we realize. Your monthly streaming subscriptions, your phone plan, maybe a PayPal or...
Stop losing revenue to failed payments
Join leading subscription businesses using Slicker to recover failed payments automatically.
Get Started