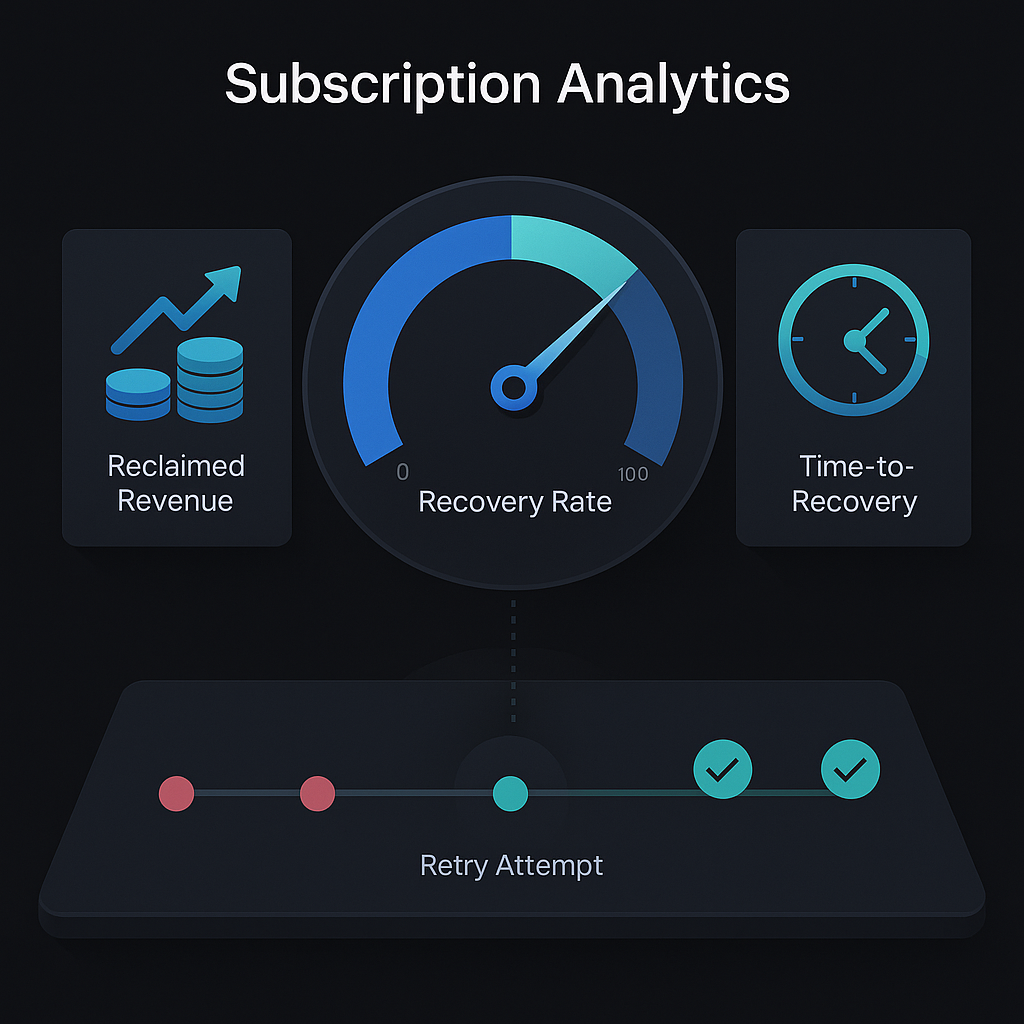
Smart dunning dashboard metrics: KPIs that move the needle

Smart dunning dashboards track recovery rate, retry success rate, and time-to-recovery metrics alongside traditional churn KPIs to isolate involuntary churn from voluntary cancellations. Advanced analytics reveal that AI-powered systems deliver 2-4x better recovery than static retry logic, with top performers achieving 70% recovery rates compared to industry averages of 47.6%.
Key Metrics That Matter
• Recovery Rate Formula: (Recovered payments / Failed payments) × 100% - industry benchmark is 47.6%, while AI engines push above 70%
• Retry Success Rate: First retry attempts typically achieve 25-35% success, making strategic timing critical for maximizing recovery
• Time-to-Recovery: Faster recovery preserves customer relationships; subscriptions recovered quickly continue for an average of seven more months
• MRR Churn vs Logo Churn: Separating revenue loss from customer count reveals whether high-value accounts are churning disproportionately
• Involuntary vs Voluntary Churn: Payment failures account for up to 42% of total churn but are largely recoverable with proper retry logic
• Cost per Recovery: Total recovery costs divided by successful recoveries determines ROI of dunning efforts
Subscription leaders finally see that smart dunning dashboard metrics, not generic churn math, spotlight the real revenue at risk.
From basic churn math to smart dunning: why metrics matter
Every subscription business tracks churn. But generic churn KPIs only tell part of the story.
"Every business should keep an eye on the customer churn rate. This metric lets you know the percentage of customers that have stopped paying for/have canceled their account with your business services or products over a given period of time." — Chargebee
The problem? Traditional metrics lump voluntary cancellations together with payment failures, obscuring where revenue actually leaks. Consider the scale: subscription companies could lose an estimated $129 billion in 2025 due to involuntary churn alone. Meanwhile, a 5% monthly churn rate equals losing nearly half your customers annually.
Advanced dashboards separate these streams, giving finance teams the granularity they need to act. Rather than reacting to aggregated numbers, leaders can pinpoint failing cohorts early and prioritize intelligent retry logic.
Key takeaway: Generic churn metrics mask the true source of revenue loss; smart dunning dashboards isolate involuntary churn so teams can target recoverable revenue.
What core churn KPIs should every subscription team track?
Before diving into recovery analytics, subscription teams need a solid foundation of standard metrics.
Customer churn (also known as logo churn) is the ratio of customers lost during a given period to the number present at the beginning of that period, according to Chargebee's churn guide. This differs from revenue churn, which measures the MRR lost from cancellations.
Core subscription KPIs include:
- Monthly Recurring Revenue (MRR) and Annual Recurring Revenue (ARR)
- Churn rate (customer and revenue)
- Customer Lifetime Value (LTV/CLV)
- Customer Acquisition Cost (CAC)
- Growth Efficiency
These metrics appear in Chargebee's SaaS metrics guide as foundational across all business stages.
Critically, teams must distinguish between voluntary churn (customers actively canceling) and involuntary churn (payment-related departures). Voluntary churn happens when customers hit the cancel button or contact support. Involuntary churn occurs when customers do not intend to leave but experience payment failures.
MRR churn & logo churn
"Your Monthly Recurring Revenue (MRR) churn rate is the measure of money lost from customers who have canceled their subscriptions over a period of time." — Chargebee
The formulas are straightforward:
| Metric | Formula |
|---|---|
| Total Subscription Churn Rate | (Subscriptions cancelled / Subscriptions active at start) × 100 |
| Cancellation MRR Rate | (Total MRR of churned subscriptions / MRR at period start) × 100 |
| Gross MRR Churn | Downgrade MRR + Cancellation MRR + Paused MRR |
The pitfall? These numbers do not reveal why customers left. A $10,000 MRR loss could stem from product dissatisfaction or simply from expired credit cards.
Retention cohorts & NRR
"The MRR retention cohort is an essential data visualization for you to analyze trends across dimensions." — Chargebee
Cohort tracking segments customers by acquisition date, revealing whether newer cohorts retain better than older ones. Net Revenue Retention (NRR) goes further by factoring in expansion revenue from upsells and cross-sells.
When NRR exceeds 100%, existing customers generate more revenue over time, a hallmark of healthy subscription businesses.
Which revenue recovery analytics actually shift the curve?
Recovery analytics move beyond asking "how many customers left?" to "how much can we bring back?"
Tracking payment recovery metrics is essential for maintaining the financial health of subscription businesses. The most telling figure is Recovery Rate, calculated as:
Recovery rate = (Total amount recovered from failed payments / Total amount of failed payments) × 100%
This metric sums the impact of retries, emails, and manual collections into one percentage. Industry benchmarks hover around 47.6%, while AI-powered engines routinely push recovery rates above 70%.
Stripe's revenue recovery overview provides key performance indicators including failed payments, failure rate, recovered payments, and recovery rate, giving teams a comprehensive view of payment health.
Smart payment retries recover up to 70% of failed transactions through AI-powered timing and multi-gateway routing, while traditional dunning email campaigns typically capture only 30%.
Recovery rate & retry-success rate
Two formulas every finance team should track:
| Metric | Formula | Example |
|---|---|---|
| Recovery Rate | (Recovered / Failed) × 100% | $37,500 recovered from $50,000 failed = 75% |
| Retry Success Rate | (Successful retries / Total retry attempts) × 100 | 350 successes from 1,000 attempts = 35% |
Retry success rate reveals how efficiently your system converts failed payments. A 25-35% success rate on first retry attempts is typical, highlighting the importance of strategic timing.
Time-to-recovery & cost per recovered payment
Efficiency KPIs matter as much as volume metrics:
- Time to Recovery = Sum of (Recovery date − Failure date) / Total recoveries
- Cost per Recovered Payment = Total recovery costs / Total recoveries
These metrics appear in RecoverPayments' framework as critical for demonstrating ROI. Faster recovery preserves customer relationships; lower cost improves margins.
Subscriptions recovered by intelligent tools continue on average for seven more months, making time-to-recovery a predictor of lifetime value.
How do you build a smart dunning dashboard with real-time alerts?
A dashboard is essential for managing operating results and forecasts, according to Forrester. But assembling the right components requires careful planning.
Dashboards for recurring revenue products should include metrics that address retention, engagement, and performance. For dunning specifically, this means:
- Failed payment volume and failure rate
- Recovery rate by method (retries, emails, manual)
- Time-to-recovery trends
- Decline reason breakdowns
- At-risk revenue alerts
Stripe's dashboard tracks recovered payments through retries, emails, and other recovery methods, with charts showing top decline codes by volume.
The Chargebee Retention Dashboard offers five out-of-the-box reports: Save Performance, Deflection Funnel, Cancels, Saves, and Active Watch List. The Save Performance Report helps monitor changes in save and deflect rates over time.
"A dashboard is the most action-oriented form of business reporting, and dashboards should be among the most carefully planned and crafted outputs of any B2B measurement and analytics team." — Forrester
Hooking into billing & gateway data
Effective dashboards require clean data pipelines from billing platforms and payment gateways.
Zuora Payments provides an end-to-end solution for managing invoices, payment gateways, and automated collections. It can optimize recurring collections with automated dunning and machine learning.
Key integrations to establish:
- Billing platform webhooks (Stripe, Chargebee, Zuora, Recurly)
- Gateway response codes and decline reasons
- Customer payment method metadata
- Historical transaction patterns
Platforms like Slicker connect to major billing systems without engineering resources, enabling rapid deployment.
Real-time alerts & pre-dunning triggers
Proactive notifications prevent churn before it happens.
Slicker's platform provides real-time alerts for at-risk customers, enabling businesses to engage before payment failures lead to churn. These pre-dunning capabilities let teams reach out about expiring cards or unusual decline patterns before revenue is lost.
Alert types to configure:
- Expiring payment methods (30/14/7 days out)
- First-time payment failures
- Repeated soft declines
- High-value accounts at risk
- Unusual decline code clusters
Case study: AI-powered retries cut churn by 40%
Theory becomes compelling when backed by results.
A mid-sized beauty subscription box company was experiencing monthly churn rates of 14%, with involuntary churn representing 42% of total losses. Their existing retry logic recovered only 18% of failed payments.
Within three months of implementing an AI-powered payment recovery platform, the company achieved:
- 40% reduction in overall churn rate (from 14% to 8.4%)
- 68% recovery rate on failed payments (up from 18%)
- Significant improvement in customer lifetime value
This case demonstrates how AI-powered recovery systems can transform involuntary churn from an accepted cost into a recoverable revenue stream.
Slicker's 5-minute setup process exemplifies rapid deployment, connecting to major billing platforms without engineering resources. The pay-for-success pricing model means businesses only pay for recovered revenue.
Recovery platforms compared: what should your dashboard reveal?
When evaluating recovery solutions, dashboards should surface key differentiators.
Multi-gateway orchestration is essential: leading solutions automatically route retries through the processor with the highest real-time acceptance probability, rather than forcing merchants to orchestrate this themselves.
Recurly's Intelligent Retries employs machine learning to determine the optimal time for retrying a declined recurring credit card payment, using data from billions of transactions.
Key evaluation criteria:
| Feature | What to look for |
|---|---|
| Recovery Rate | 2-4× improvement over native billing logic |
| Retry Logic | AI-powered, individualized timing |
| Gateway Routing | Multi-gateway smart routing |
| Compliance | Card network retry limits (15 attempts in 30 days) |
| Pricing | Pay-for-success vs. flat SaaS fees |
| Transparency | Click-through logs for every action |
Visa and Mastercard limit merchants to around 15 retry attempts in 30 days, making intelligent timing critical.
Slicker delivers 2-4× better recovery than native billing-provider logic through its proprietary AI engine, which processes each failing payment individually rather than using generic retry schedules. The pay-for-success pricing model aligns vendor incentives with customer outcomes.
Putting KPIs to work: next steps to slash involuntary churn
Smart dunning dashboard metrics transform how subscription businesses approach revenue recovery.
Start by separating voluntary from involuntary churn in your reporting. Build dashboards that track recovery rate, retry success, and time-to-recovery alongside traditional metrics. Configure real-time alerts for at-risk accounts.
The companies seeing results are those moving beyond basic churn math to precision analytics. With AI-powered systems delivering 2-4× better recovery rates than static retry logic, the opportunity cost of inaction compounds monthly.
For high-volume subscription companies using Chargebee, Zuora, or in-house billing systems, Slicker's AI engine sits on top of existing payment rails to reduce involuntary churn, increase recovered revenue, and boost business margins. The pay-for-success pricing means you only pay for additional revenue generated.
Explore how AI enhances payment recovery and start turning failed payments into retained customers.
Frequently Asked Questions
What are smart dunning dashboard metrics?
Smart dunning dashboard metrics are advanced analytics tools that separate voluntary and involuntary churn, allowing businesses to pinpoint revenue leaks and optimize recovery strategies.
How do smart dunning dashboards differ from traditional churn metrics?
Traditional churn metrics often aggregate voluntary and involuntary churn, obscuring revenue loss sources. Smart dunning dashboards provide granular insights, focusing on involuntary churn to enhance recovery efforts.
What are the core KPIs for subscription businesses?
Core KPIs include Monthly Recurring Revenue (MRR), Annual Recurring Revenue (ARR), churn rate, Customer Lifetime Value (LTV), and Customer Acquisition Cost (CAC). These metrics help track business health and growth.
How can AI improve payment recovery rates?
AI enhances payment recovery by optimizing retry timing and routing through multiple gateways, significantly increasing recovery rates compared to traditional methods. Slicker's AI engine, for example, can boost recovery rates to over 70%.
What role does Slicker play in reducing involuntary churn?
Slicker integrates with existing billing systems to reduce involuntary churn by using AI-powered retries and smart dunning dashboards, improving recovery rates and business margins.
Sources
- https://www.slickerhq.com/blog/top-7-ai-retry-engines-2025-yc-backed-slicker-flexpay-gocardless
- https://www.slickerhq.com/blog/2025-failed-payment-benchmarks-ai-beats-industry-averages
- https://www.chargebee.com/blog/churn-indicators-rate-reduction-guide/
- https://recurly.com/resources/report/churn-benchmarks/
- https://www.chargebee.com/blog/reduce-customer-churn/
- https://chargebee.com/resources/guides/saas-metrics
- https://www.chargebee.com/blog/saas-kpis-metrics-covid/
- https://recoverpayments.com/payment-recovery-metrics/
- https://docs.stripe.com/billing/revenue-recovery/recovery-analytics
- https://www.slickerhq.com/blog/smart-payment-retries-vs-dunning-which-recovers-more-in-2025
- https://pagos.ai/use-cases/retry-strategy
- https://www.slickerhq.com/blog/dunning-emails-vs-intelligent-retry-logic-2025-subscription-revenue-recovery
- https://www.forrester.com/report/the-dashboard-for-recurring-revenue-offerings/RES173277
- https://www.chargebee.com/docs/retention/reporting/navigating-the-dashboard
- https://docs.zuora.com/en/zuora-payments/overview/zuora-payments-overview
- https://www.slickerhq.com/blog/proactive-customer-retention-tools-slicker-vs-traditional-payment-recovery-40-percent-improvement
- https://www.slickerhq.com/blog/2025-failed-payment-benchmarks-b2c-subscription-ecommerce-ai-recovery
- https://docs.recurly.com/recurly-subscriptions/docs/retry-logic
- https://www.slickerhq.com/blog/can-smart-payment-retries-reach-90-recovery-reality-check
- https://www.slickerhq.com/pricing
- https://www.slickerhq.com/blog/how-ai-enhances-payment-recovery
Related Articles
Top Failed Payment Recovery Tools for E-Commerce Subscriptions (May 2026 Update)
Failed payments drain roughly 9% of monthly recurring revenue, per PYMNTS research, often before finance teams spot the leak. Subscription companies could lose...
Top Involuntary Churn Prevention Tools for B2B Subscription Businesses in May 2026
Failed payments look identical to voluntary cancellations on your dashboard, but they require completely different responses. Research shows 20-40% of all...

What Are the Best AI Dunning Tools for Reducing Passive Churn? (May 2026)
The label AI gets slapped on every dunning tool with a retry scheduler these days, but real AI dunning solutions make decisions your billing system can't. They...
Stop losing revenue to failed payments
Join leading subscription businesses using Slicker to recover failed payments automatically.
Get Started