What Is AABB Testing in Payment Recovery and Why Does It Matter? (May 2026)
Most subscription businesses track a recovery rate number in their dashboard. When it moves up, the harder question is why. Was it the dunning sequence? Fewer card expirations that month? Or did your issuer approve more transactions for reasons completely outside your control?
Standard A/B testing payment recovery gets you halfway there, but it cannot separate strategy impact from timing artifacts or cohort imbalances. AABB testing adds a calibration phase that catches contamination before you draw any conclusions.
If the two groups do not recover at the same rate under identical conditions in the AA window, your test is already compromised. Once calibration passes, the BB phase measures your actual treatment effect with statistical significance payment recovery teams can act on. The result is a lift figure tied to a p-value, which is what dunning ROI measurement looks like when you need to defend the number to finance. Recovering an extra 5% of failed payments is only valuable if you know the 5% is real.
TLDR:
- AABB testing splits your subscriber base into four groups and runs an AA calibration phase before the BB treatment to catch seasonal drift and cohort contamination that standard A/B tests miss.
- Recovery vendors promise 40% lifts without disclosing control groups, making AABB testing the only way to separate real recovery gains from billing-cycle noise.
- Statistical significance (p-value below 0.05) separates genuine dunning ROI from random variation, and reaching it requires thousands of failed payments per month.
- True dunning ROI includes CAC avoided and the churn multiplier effect (involuntary churn compounding into voluntary churn), beyond recovered MRR alone.
- Slicker runs a clinical-grade AABB test on your live traffic (50/50 split, no engineering work, ~5 minutes to connect) and reports the p-value before asking for commitment.
What AABB Testing Is and Why It Differs from Standard A/B Testing
AABB testing is a payment-specific variant of A/B testing built for subscription recovery contexts. Where standard A/B testing splits users into two groups and measures a single outcome like click-through rate, AABB testing runs two sequential measurement windows on the same audience: an "AA" phase that confirms both groups behave identically under identical conditions, then a "BB" phase that introduces the recovery treatment to one group.
This two-phase structure solves a real problem in dunning measurement. Standard A/B tests in payment recovery are vulnerable to seasonal billing cycles and cohort drift, which can make a treatment look effective when it isn't.
Testing Method | Structure | Contamination Detection | Best Use Case |
|---|---|---|---|
Standard A/B Testing | Single measurement window with two groups split once at the start of the test | Cannot catch seasonal billing cycles or cohort drift that skew results toward false positives | Narrow decisions like email subject lines or dunning message cadence variations |
AABB Testing | Sequential design with AA calibration phase followed by BB treatment phase using four parallel groups | AA phase confirms both groups behave identically before treatment, catching contamination before conclusions are drawn | Vendor evaluation, processor migration, and retry logic overhauls where false positives mean months of compounding MRR loss |
Why the Sequential Design Matters
The AA phase acts as a calibration check. If the two groups don't recover revenue at the same rate before any treatment is applied, the test is already compromised. AABB testing catches that contamination before you draw a conclusion.
The result is a higher bar for statistical significance, giving finance leaders a recovery lift figure they can trust enough to act on.
How AABB Testing Works: The Four-Group Split and Stratified Randomization
AABB testing splits your subscriber base into four distinct groups rather than the two used in standard A/B testing. Two groups receive your existing recovery logic as a control, and two receive the challenger treatment. Running parallel control groups lets you measure natural variance in payment behavior, so any performance difference you observe between treatment and control is far less likely to be noise.
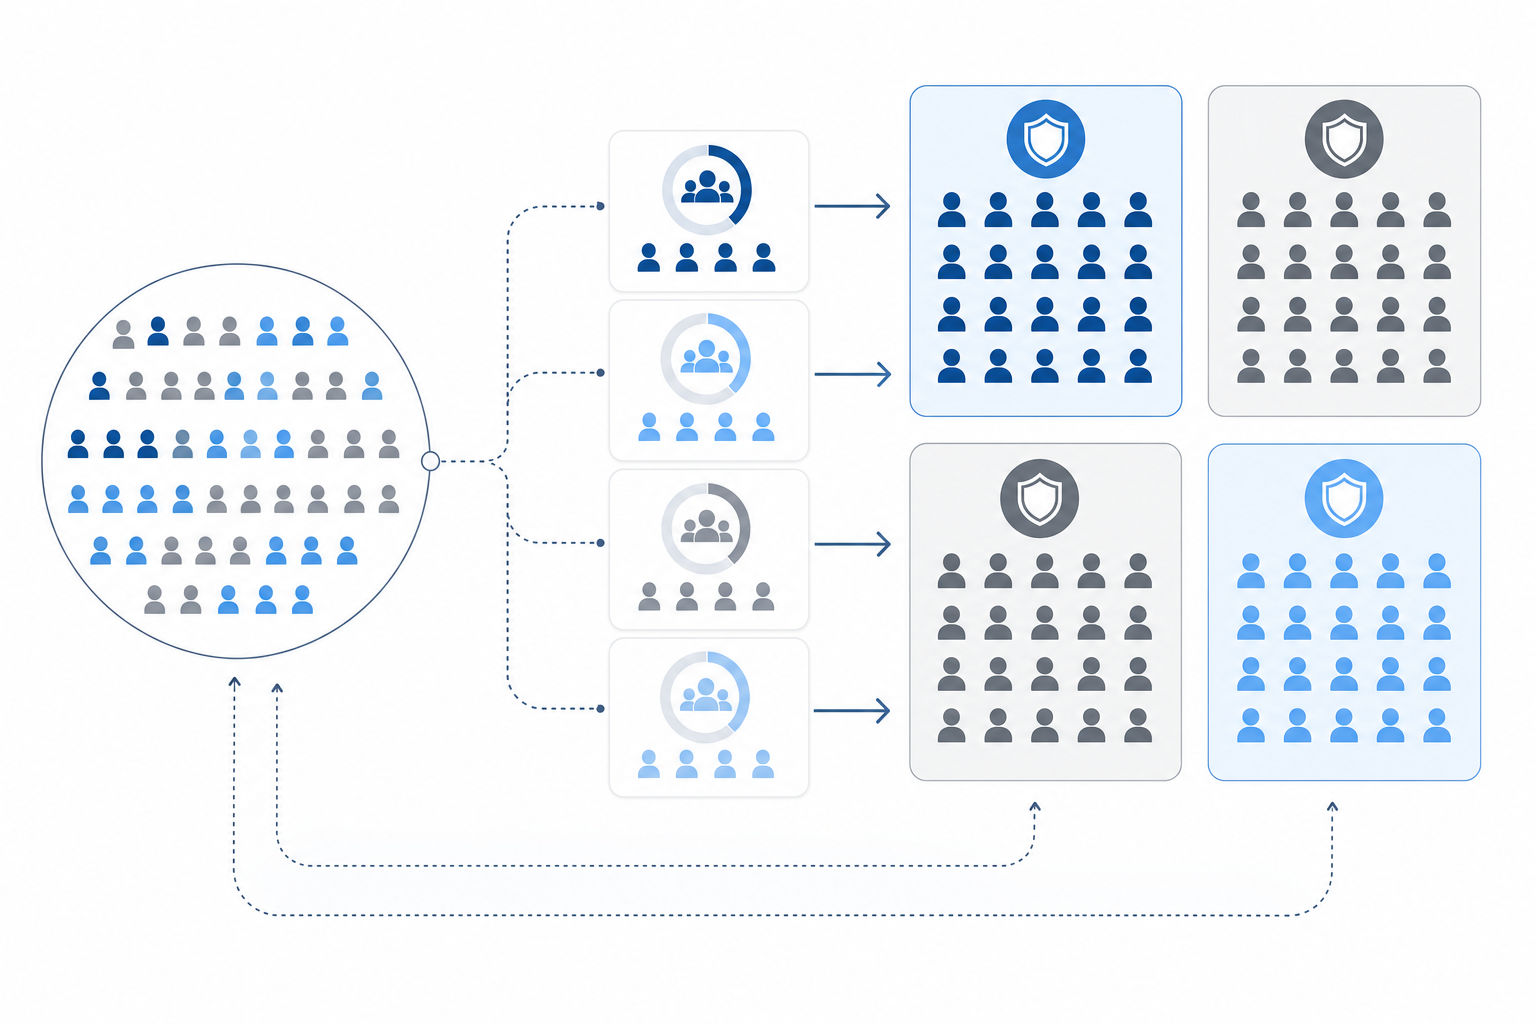
Stratified randomization goes a step further by sorting subscribers into segments before assigning them to groups. Factors like billing cycle, card type, and failure reason are balanced across all four cohorts, so a disproportionate share of easy-to-recover accounts cannot skew your results toward either side.
The outcome is a recovery measurement you can actually trust, one where statistical significance confirms that the lift is real before you commit to anything.
Why Payment Recovery Needs Rigorous Testing: The Vendor Claims Problem
Recovery vendors routinely promise dramatic lift numbers. The trouble is those numbers are almost never independently verified. A vendor says their retry logic recovered 40% more revenue (a figure commonly cited in vendor marketing, not an independently audited result), but recovered more than what, exactly? More than doing nothing? More than a basic retry on day three? The benchmark matters as much as the result, and most vendors never tell you what their control group looked like.
This creates a real measurement problem. Without a properly structured test, any observed improvement could reflect seasonal billing patterns, cohort differences, or plain statistical noise rather than the vendor's actual contribution.
Rigorous payment recovery testing matters because the stakes are direct and measurable: every percentage point of recovery rate translates to recovered MRR you already earned from customers who already said yes.
Statistical Significance in Payment Recovery: Measuring What Actually Matters
Without statistical significance, payment recovery results are just noise. A 5% lift in recovered revenue sounds promising until you learn it came from a sample of 200 transactions over two weeks. That result could easily be random variation.
Statistical significance in payment recovery testing answers a direct question: how confident can you be that your results reflect a real difference, not chance? The standard threshold is a p-value below 0.05, meaning there is less than a 5% probability the observed difference occurred randomly. Interpreting A/B test results correctly prevents false positives that lead to poor business decisions.

For dunning ROI measurement, this matters because:
- Small sample sizes produce unreliable conclusions, and most subscription businesses need weeks of data volume to reach significance
- Seasonal billing patterns can skew short-window tests, making a mediocre strategy look strong
- Without a concurrent control group, you cannot isolate whether your recovery rate improved because of your strategy or because of external factors like issuer behavior changes
Reaching statistical significance before committing to a recovery strategy is what separates real performance gains from expensive guesswork.
Common Testing Pitfalls: Sequential Testing, Sample Size Errors, and Bias
Even well-designed tests fail when execution breaks down. Three errors show up repeatedly in payment recovery contexts.
Sequential testing means peeking at results daily and stopping the moment you see a promising number. Each additional peek inflates your false-positive rate, so a result that looks like a win at day 10 may be random noise. Commit to your sample size before the test starts and don't touch it.
Underpowered tests are the quiet culprit behind inconclusive results. If your cohort is too small to detect a 5-10% recovery lift with statistical confidence, you'll misread real gains as flat performance.
Survivorship bias creeps in when you measure only customers who successfully retry, ignoring those who churned before the test window closed. That skews recovery rates upward and makes every variant look better than it is.
When AABB Testing Makes Sense (and When It Doesn't)
AABB testing earns its complexity when the stakes are structural. Vendor evaluation, processor migration, and retry logic overhauls all require four-group validation because a false positive means committing to the wrong system for months of compounding MRR loss.
Volume is the binding constraint. Reaching statistical significance requires roughly 2,000+ failed payments per month (p<0.05 for a 10% lift detection threshold), making AABB testing well-suited to businesses with substantial recurring revenue. Lower-volume operations may find the test window stretches too long to be practical.
When standard A/B testing is enough
For narrower decisions, standard A/B testing handles the job well. Two email subject lines or a dunning message cadence variation don't call for four groups or a calibration phase. Reserve AABB's structure for decisions that affect your core recovery infrastructure, because that's the level of certainty the added complexity is built to produce.
A practical decision rule:
- Use standard A/B testing for isolated tactics — subject line copy, send time variation, email tone, or minor cadence tweaks. The blast radius of a wrong call is small and reversible.
- Use AABB testing for system-level changes — vendor swaps, processor migrations, retry logic overhauls, or any change that touches how your core recovery stack processes failed payments. A false positive here locks you into the wrong infrastructure for months.
Measuring ROI Beyond Recovery Rate: The Full Cost Picture
Recovery rate is the headline metric, but it rarely tells the full financial story. To measure dunning ROI accurately, you need to account for the complete cost picture.
Here are the key inputs worth tracking:
- Customer acquisition cost (CAC) avoided: Every recovered subscriber is one you don't have to re-acquire, which at typical CAC-to-LTV ratios can dwarf the recovered monthly payment itself.
- Direct cost per recovery: Manual outreach, support tickets generated by failed payment emails, and internal escalations all carry real labor costs that automated recovery reduces.
- Churn multiplier effect: Involuntary churn compounds into voluntary churn when frustrated customers cancel rather than update payment details, making recovery value larger than a single month's MRR.
Without a control group, none of these inputs can be cleanly attributed to your dunning changes. AABB testing gives you the counterfactual you need to isolate true incremental revenue.
The Business Case for Clinical-Grade Testing in Payment Recovery
Payment recovery without a control group is guesswork. You might believe your dunning sequence is working, but without a baseline to measure against, you cannot separate the impact of your recovery logic from customers who would have resolved their payment issues anyway.
This is where clinical-grade AABB testing changes the calculation. Borrowed from drug trial methodology, it splits live payment traffic into a control group and a treatment group, measures actual dollars recovered across both, and reports a p-value before you commit to any change. The result is a provable recovery rate uplift, not a vendor's promise.
For CFOs and Heads of Retention, the stakes are direct: every percentage point of recovery rate improvement maps to measurable MRR, making statistical significance in dunning ROI measurement a finance question, not a technical one.
How Slicker Uses AABB Testing to Prove Recovery Performance
Slicker runs a clinical-grade AABB test before asking for any commitment. Your traffic splits 50/50: half goes through Slicker's AI-powered recovery, half stays on your existing logic as the control. Both groups run in parallel under identical conditions, so external variables like seasonal churn or market swings affect each cohort equally.
After a statistically sufficient observation window, Slicker reports the p-value alongside dollars recovered per cohort. If the result doesn't clear the significance threshold, see how pay-for-success pricing works. The proof comes from your own data, not Slicker's marketing copy.
Setup requires no engineering work and takes ~5 minutes, connecting directly to your existing billing infrastructure without touching your PCI-compliant payment credentials.
Final Thoughts on Why Payment Recovery Needs Clinical-Grade Measurement
The dunning space is full of dramatic claims no one can verify. AABB testing solves that by splitting your traffic, running both variants in parallel, and reporting statistical significance before asking for a dollar. It's slower than trusting a sales deck, but it's the only way to know whether a 15% recovery lift is real or random variance you're about to bet your retention strategy on. Start with a clinical test and prove the number before you commit.
FAQ
What is the average improvement in failed payment rates when using AI?
Across Slicker client tests, AI-powered recovery has recovered 20-50% more failed payments compared to standard retry logic, with the exact lift depending on your subscriber mix, billing cycles, and issuer distribution. Those figures come from controlled AABB tests with concurrent control groups, not self-reported vendor data. The only way to know your specific improvement is to measure it with a controlled test on your own traffic.
How does AABB testing differ from standard A/B testing for payment recovery?
AABB testing adds a calibration phase before the treatment window to catch seasonal billing cycles and cohort drift that standard A/B tests miss. Standard A/B testing splits users once and measures a single outcome window, leaving it exposed to billing-pattern contamination that can make a mediocre recovery strategy look effective when it isn't.
What sample size do I need to reach statistical significance in payment recovery testing?
Reaching a p-value below 0.05 requires roughly 2,000-5,000 failed payments per month, depending on expected lift magnitude and variance in your subscriber mix. Most tests need weeks of data volume before results become conclusive. Underpowered tests with insufficient sample sizes will misread real recovery gains as flat performance, making volume the binding constraint for when AABB testing makes practical sense.
Can I run AABB testing alongside my existing payment recovery setup?
Yes. AABB testing splits your live payment traffic 50/50 between your current recovery logic (control) and the challenger treatment, running both in parallel without disrupting existing operations. Setup takes roughly five minutes and requires no engineering work, connecting directly to your billing infrastructure while your existing system continues handling the other half of traffic.
How do I measure dunning ROI beyond recovery rate?
Track CAC avoided (every recovered subscriber eliminates re-acquisition cost), direct cost per recovery (manual outreach and support tickets carry real labor costs), and the churn multiplier effect (involuntary churn compounds into voluntary churn when frustrated customers cancel).
Related Articles
AI for Failed Payment Recovery in Subscription SaaS (July 2026)
I'll be frank: most of the failed payment recovery advice out there focuses on dunning, when the bigger win is usually in the retry logic that runs before a...
Failed Payment Recovery: Evaluating Categories and Vendors (July 2026)
Choosing failed payment recovery software gets complicated quickly. There are standalone retry engines, dunning tools, billing-native recovery, and full-stack...
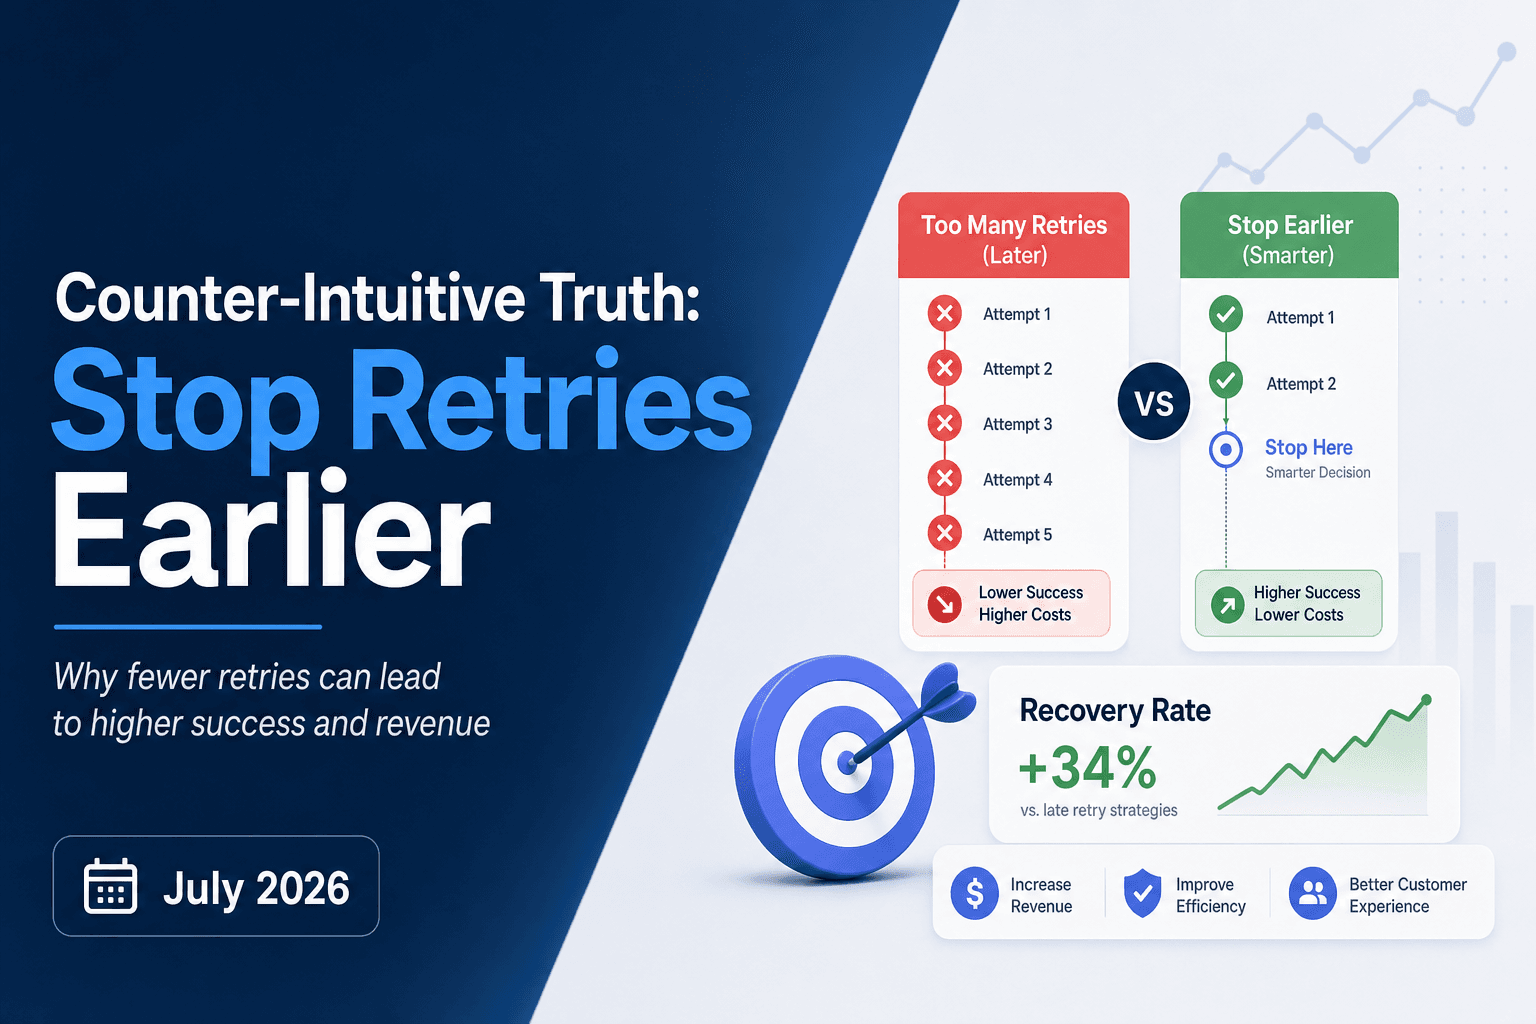
Counter-Intuitive Truth: Stop Retries Earlier (July 2026)
Most billing teams treat more retries as a safer bet. Run the full sequence, exhaust every attempt, and at least you know you tried. But retry exhaustion has a...
Stop losing revenue to failed payments
Join leading subscription businesses using Slicker to recover failed payments automatically.
Get Started