How to Measure the ROI of Your Failed Payment Recovery Strategy (May 2026)
Failed payments cost you 9% of revenue annually, but here's the harder question: is your recovery program actually profitable?
TLDR:
- Track recovery rate uplift, revenue recovered, involuntary churn, days to recovery, and cost per dollar to measure ROI.
- Subscription companies lose 9% of revenue to failed payments annually, with gaps of 10-25 percentage points between average and top recovery rates across verticals.
- Calculate ROI by multiplying failed payment volume by uplift percentage and average transaction value, then subtract recovery program costs.
- Measure incremental lift with control groups, not gross recovery, since subscribers who self-retry were never true wins.
- Slicker runs AABB testing with statistical significance on your data before you pay, splitting traffic 50/50 to prove recovery rate uplift with p-values.
What Is Failed Payment Recovery ROI and Why It Matters
Failed payment recovery ROI measures the net revenue you recapture from declined transactions relative to the cost of your recovery program. For subscription businesses, where a single recovered customer compounds over their remaining lifetime, this ratio carries more weight than most finance teams assign it.
The gap between what you're recovering and what you could be recovering is where ROI lives. Most subscription companies lose 9% of revenue to failed payments annually, yet the average recovery program captures only a fraction of what's theoretically retrievable. Closing that gap by even a few percentage points can move MRR (monthly recurring revenue) materially.
The Core Metrics You Need to Track
Recovery rate uplift is the headline number, but it tells an incomplete story on its own. To measure whether your payment recovery metrics is actually working, you need a tight set of metrics that connect activity to revenue.
Here are the core numbers to track:
- Recovery rate: the percentage of failed payments that are successfully collected within a defined window, typically 30 days.
- Revenue recovered: the actual dollar value recaptured, beyond transaction count.
- Involuntary churn rate: the share of cancellations caused by payment failure rather than voluntary cancellation. These are distinct problems with distinct fixes.
- Days to recovery: how quickly payments are resolved, since slower recovery connects to higher permanent churn.
- Recovery cost per dollar: what you spend on retries, messaging, and tooling relative to what you get back.
Together, these metrics give you a baseline to measure against, and a baseline is the only honest way to know if any change you make is producing real lift.
Recovery Rate Benchmarks by Industry and Payment Method
Recovery rates vary more than most finance teams expect, and the gap between a "typical" result and a great one depends heavily on your vertical and payment mix.
Benchmarks by Industry
Industry | Avg. Recovery Rate | Top-Quartile Recovery Rate |
|---|---|---|
SaaS / B2B | 55–65% | 75%+ |
Consumer subscriptions | 45–55% | 65%+ |
Digital media / streaming | 50–60% | 70%+ |
Health & wellness | 40–52% | 62%+ |
Benchmarks by Payment Method
- Credit cards recover at the highest rates (60–70% for top-quartile programs) due to soft decline codes that signal retryable failures.
- Debit cards carry higher hard-decline rates, so recovery requires tighter timing windows.
- ACH/bank debits see lower recovery but respond well to pre-dunning balance nudges before retry.
Source: Slicker 2025 Failed Payment Recovery Benchmarks. Ranges reflect observed recovery rates across Slicker's customer base by vertical.
If your numbers sit below these ranges, the gap represents recoverable MRR you already earned.
Calculating Your Baseline: Revenue at Risk
Before you can judge whether your recovery strategy is working, you need to know what's actually at stake.
Start with three numbers:
- Monthly failed payment volume: how many transactions decline in a given month, pulled directly from your billing system or payment processor reports.
- Average revenue per affected subscriber: the MRR or ACV (annual contract value) tied to accounts with at least one failed payment, not your blended average across all subscribers.
- Current recovery rate: the percentage of those failed payments you successfully collect before the subscriber churns involuntarily.
Multiply failed payment volume by average revenue per subscriber, and you have your revenue at risk. That's the ceiling your recovery strategy is working against every month.
The ROI Calculation Formula: Step by Step
Recovery rate uplift is the foundation of any ROI calculation, but translating that uplift into a dollar figure requires a structured formula most teams skip. Start with your baseline recovery rate — the percentage of failed payments your current setup recovers without any intervention changes. Then measure your post-implementation rate. The difference is your uplift.
From there, the math is straightforward:
- Multiply your monthly failed payment volume by the uplift percentage to get incremental recoveries
- Multiply incremental recoveries by your average transaction value to get gross recovered revenue
- Subtract the cost of your recovery solution to arrive at net ROI
For example, if you process 1,000 failed payments monthly at an average of $80, and your recovery rate improves by 15 percentage points, that's 150 additional recovered transactions worth $12,000 per month in gross revenue.
One Number That Changes Everything
That monthly figure compounds. A $12,000 monthly recovery gain is $144,000 annually, before accounting for the downstream LTV (lifetime value) of retained subscribers. Customers you recover stay subscribed, renew, and upsell, so the true revenue impact exceeds the transaction-level math.
Run this calculation monthly to spot whether your recovery rate uplift is holding, improving, or decaying over time. Decay is common when retry logic isn't adapting to issuer behavior changes.
Measuring Incremental Lift vs. Baseline Recovery
Recovery rate is the headline metric, but it only tells half the story. The number that actually matters is incremental lift: how many payments did your recovery strategy recover that would have failed without it?
Without a proper control group, you are measuring gross recovery, not net value. A subscriber who retries their own card after a soft decline was never a true recovery win.
The Control Group Problem
Isolating true incremental lift requires splitting traffic and comparing outcomes against an untreated baseline, which is exactly what clinical-grade AABB testing does.
Time to Recovery and Cash Flow Impact
Faster recovery directly improves your cash flow position. Every day a failed payment sits unresolved is a day that revenue sits outside your books. Subscription businesses that recover payments within 7 days see materially better DSO (days sales outstanding) figures than those relying on passive retry schedules that drag recovery windows out to 30 days or longer.
Tracking time-to-recovery as a metric tells you how quickly your strategy converts failed payments into collected revenue, which has a compounding effect on MRR recognition and forecasting accuracy.
Hidden Costs: What to Include in Your ROI Analysis
Most ROI calculations stop at the software line item. A complete cost picture also includes no-code setup (~5 minutes, zero engineering lift), ongoing staff monitoring, and customer support overhead generated by payment-related subscriber inquiries.
Pricing structure changes the math in a less obvious way. Performance-based pricing, where you pay a percentage of recovered revenue, ties your cost directly to outcomes. ROI stays coherent because costs only rise when recovery rises. Fixed subscription pricing charges a flat rate regardless of volume, which can make ROI look stronger during low-failure months and weaker during spikes, even if the strategy itself hasn't changed.
Understating costs is the most common error in recovery ROI analysis. It produces inflated figures that breed overconfidence, and overconfidence makes it harder to notice when your strategy is underperforming.
Comparing Recovery Strategies: Retries vs. Dunning vs. Account Updaters
Each recovery channel targets a different failure type, and measuring them in isolation gives you an incomplete picture of overall payment recovery ROI.
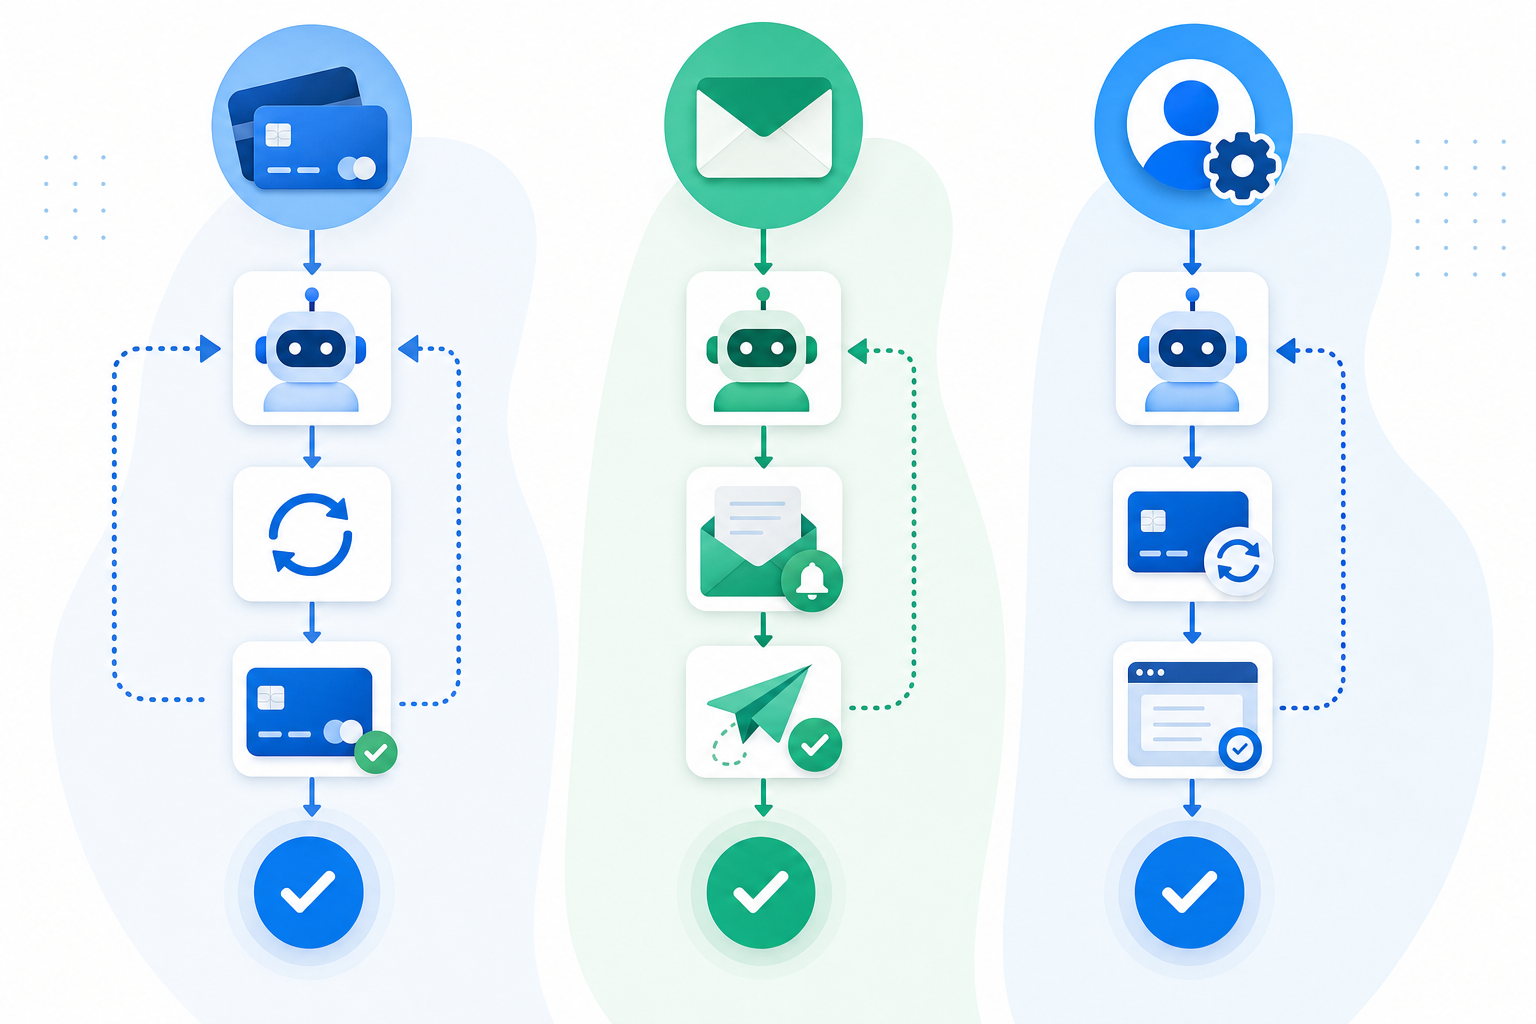
Smart Retries
AI-powered smart retries work silently, recovering payments without customer involvement. Measure them by retry success rate per decline code, recovery rate uplift versus a control group, and revenue recovered per retry attempt.
Dunning Campaigns
Track email open rates, click-through rates, and payment completion rates by message sequence position.
Account Updaters
Measure card update rate and the percentage of recovered subscriptions attributed to automatic credential refresh versus manual customer action.
ROI Variability by Business Model and Customer Segment
Blending all subscribers into a single recovery rate will mislead you. A $7/month consumer subscription carries a very different ROI profile than a $12,000/year B2B contract, even at identical raw recovery rates.
B2C subscriptions at lower price points tend to see higher failure rates, partly because they attract debit and prepaid instruments with thinner balances. Recovery value per transaction is low, so the ROI math only works at volume. One percentage point of uplift across a million low-value subscribers can still move the needle materially, but measuring it against a blended average will hide whether your recovery program is working for that cohort.
B2B annual contracts flip the equation. Failure volume is lower, but a single unrecovered invoice can mean thousands in lost ARR (annual recurring revenue).
Monthly billing also creates more retry windows per year than annual billing, giving smart retry logic more surface area to work with before a subscriber churns involuntarily. According to recent subscription economy data, failed annual renewals are recaptured at only a 23% rate, compared to 53% for failed monthly plan payments, highlighting a structural trade-off between LTV and recovery flexibility.
Segment recovery metrics by plan type, billing frequency, and payment method. The cohort most needing attention won't always be the one dragging your blended number down.
How Slicker Proves ROI Before You Pay
Slicker's core differentiator is AABB testing with statistical validity before you commit to paying. Your subscriber base is split 50/50: one group goes through your existing retry logic, the other through Slicker's AI-powered recovery. After a statistically valid sample, you see exactly how many more dollars Slicker recovered, along with the p-value confirming it isn't noise.
There's no "trust us." The proof runs on your own data, in your own environment, before a contract is signed.
What Gets Measured
- Recovery rate uplift: the percentage-point increase in recovered payments versus your control group, showing the direct impact on subscription revenue recovery.
- Incremental revenue recovered: real dollars attributed to Slicker's retry logic, not blended into a figure you can't verify.
- Statistical confidence: the p-value attached to every result so your CFO knows the outcome is real, not a favorable sample.
If Slicker doesn't beat your control with statistical significance, you don't pay. That's the clearest measure of failed payment recovery ROI available.
Final Thoughts on Proving Recovery ROI With Your Own Data
Recovery metrics only matter when they connect directly to dollars you can put back on your books. Blended averages hide whether your strategy is working for high-value cohorts, and measuring gross recovery without a control group inflates your sense of what's real. The cleanest way to know if a recovery program beats what you're doing today is to split traffic and measure the difference with statistical significance. Talk to us if you want to see exactly how much more Slicker would recover from your failed payments before signing anything.
FAQ
Can I prove payment recovery ROI without waiting months to see results?
Yes. AABB testing lets you split traffic 50/50 and measure incremental recovery against a control group, producing statistically significant results in 2–4 weeks instead of months. This methodology isolates true lift from baseline recovery, giving you a p-value confirming the outcome is real before you commit to any contract.
What's the difference between recovery rate and recovery rate uplift?
Recovery rate is the total percentage of failed payments you collect, including payments customers would have retried on their own. Recovery rate uplift is the incremental percentage-point increase attributable to your specific strategy, measured against a control group. Only uplift tells you what your recovery solution is actually contributing.
How do I calculate the revenue impact of a 15-point recovery rate improvement?
Multiply your monthly failed payment volume by the uplift percentage (e.g., 1,000 failed payments × 15% = 150 additional recoveries), then multiply by your average transaction value. A 15-point uplift on 1,000 failures at $80 each delivers $12,000 monthly, or $144,000 annually, before accounting for the downstream LTV of retained subscribers.
Smart retries vs dunning emails for failed payment recovery?
Smart retries work silently in the background and recover payments without customer involvement, making them the first line of defense. Dunning emails serve as the fallback for payment errors that specifically require customer action (expired cards, stolen cards). The highest-performing strategies combine both, with retries handling soft declines and dunning deployed only when necessary.
Related Articles
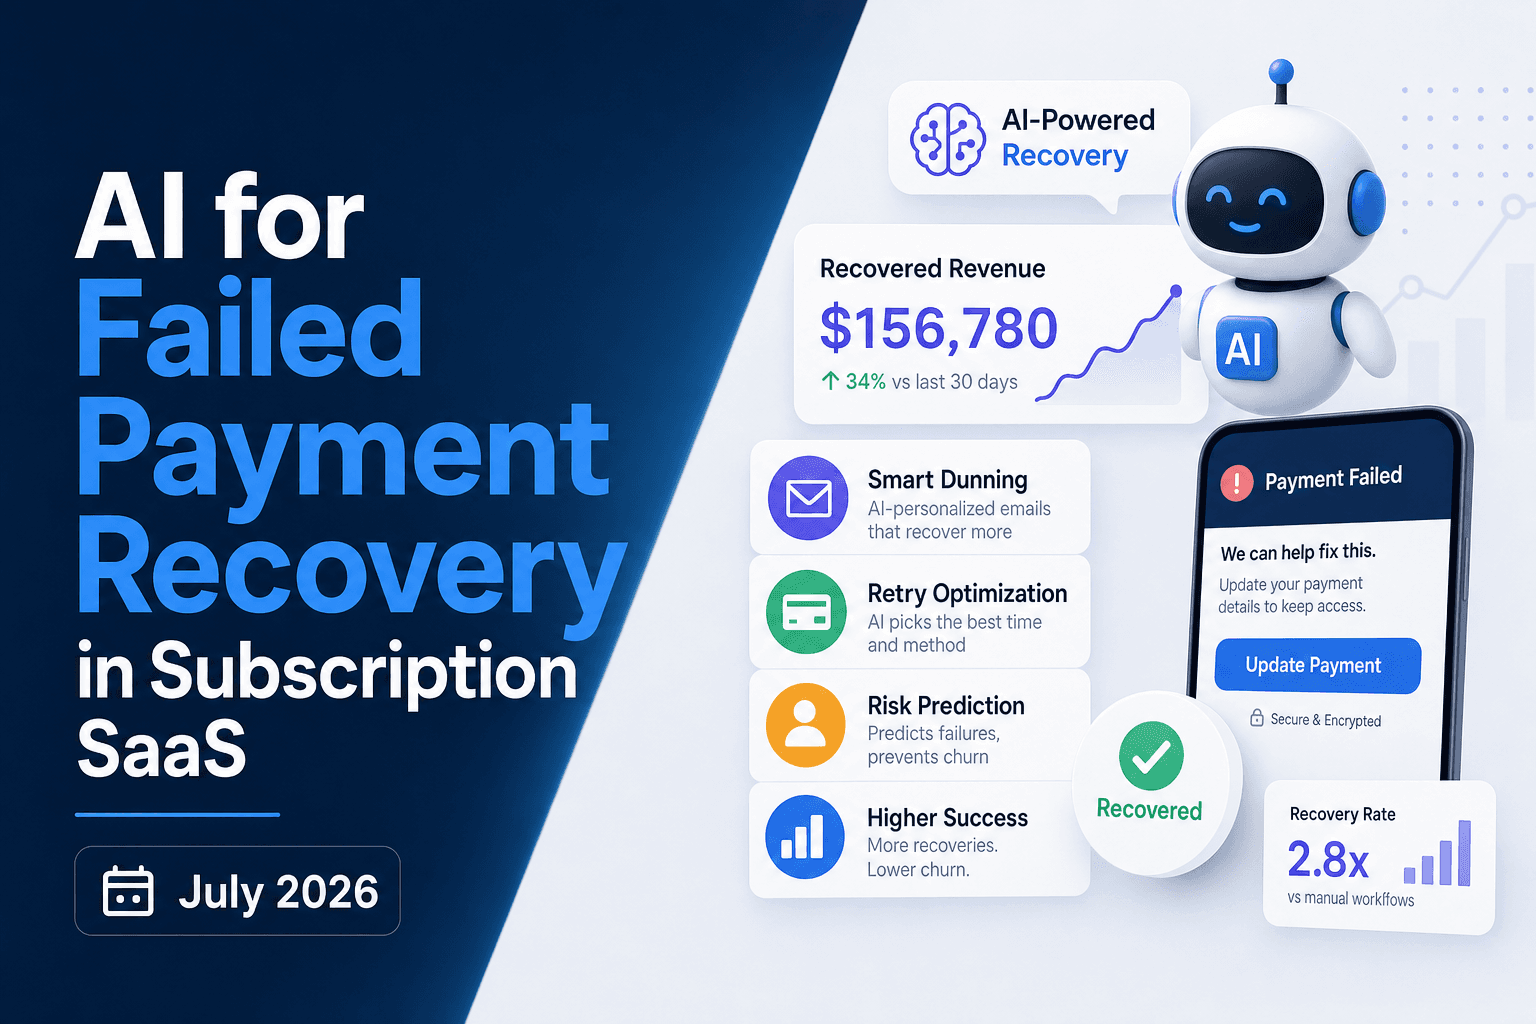
AI for Failed Payment Recovery in Subscription SaaS (July 2026)
I'll be frank: most of the failed payment recovery advice out there focuses on dunning, when the bigger win is usually in the retry logic that runs before a...
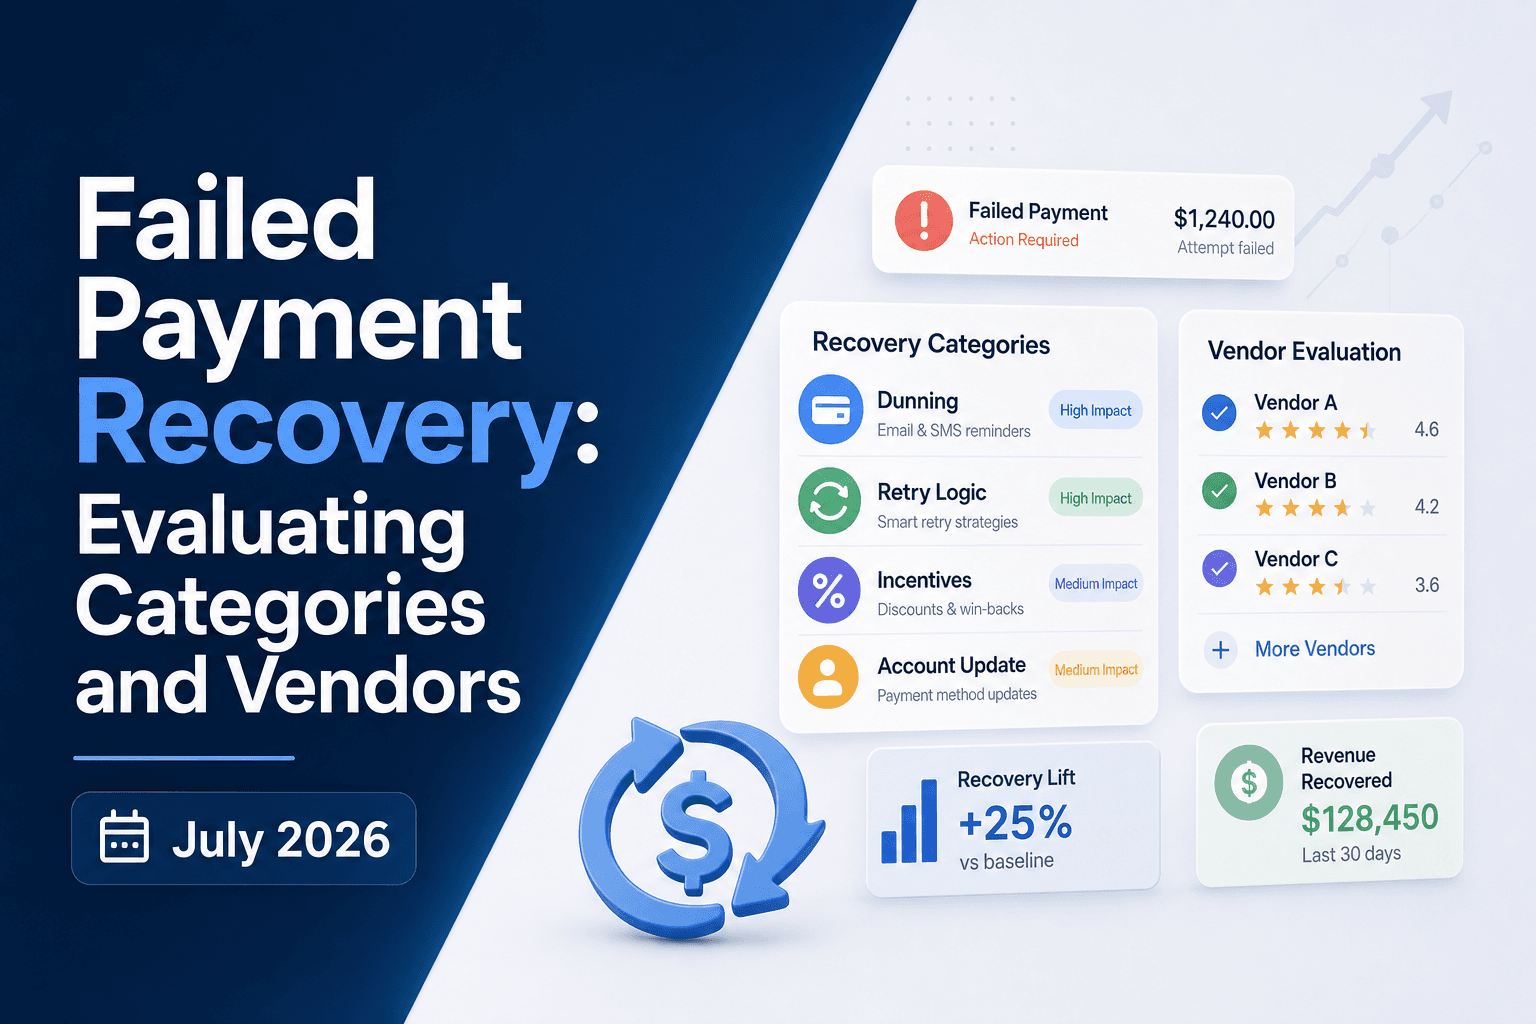
Failed Payment Recovery: Evaluating Categories and Vendors (July 2026)
Choosing failed payment recovery software gets complicated quickly. There are standalone retry engines, dunning tools, billing-native recovery, and full-stack...
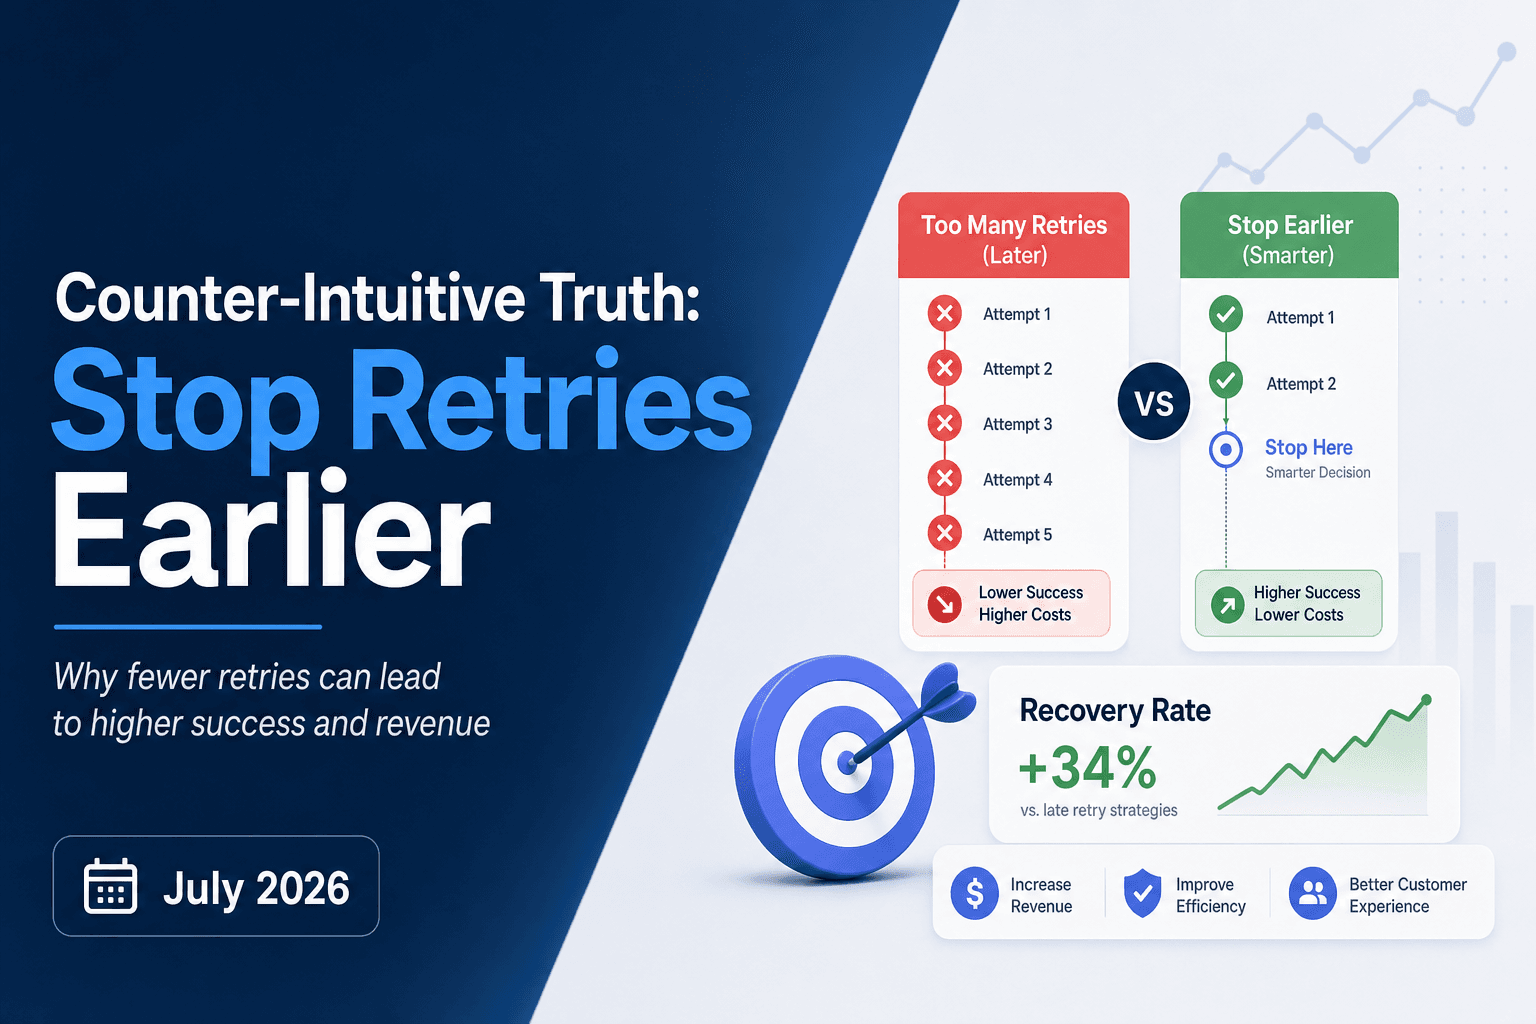
Counter-Intuitive Truth: Stop Retries Earlier (July 2026)
Most billing teams treat more retries as a safer bet. Run the full sequence, exhaust every attempt, and at least you know you tried. But retry exhaustion has a...
Stop losing revenue to failed payments
Join leading subscription businesses using Slicker to recover failed payments automatically.
Get Started