How to Track and Fix Involuntary Churn October 2026
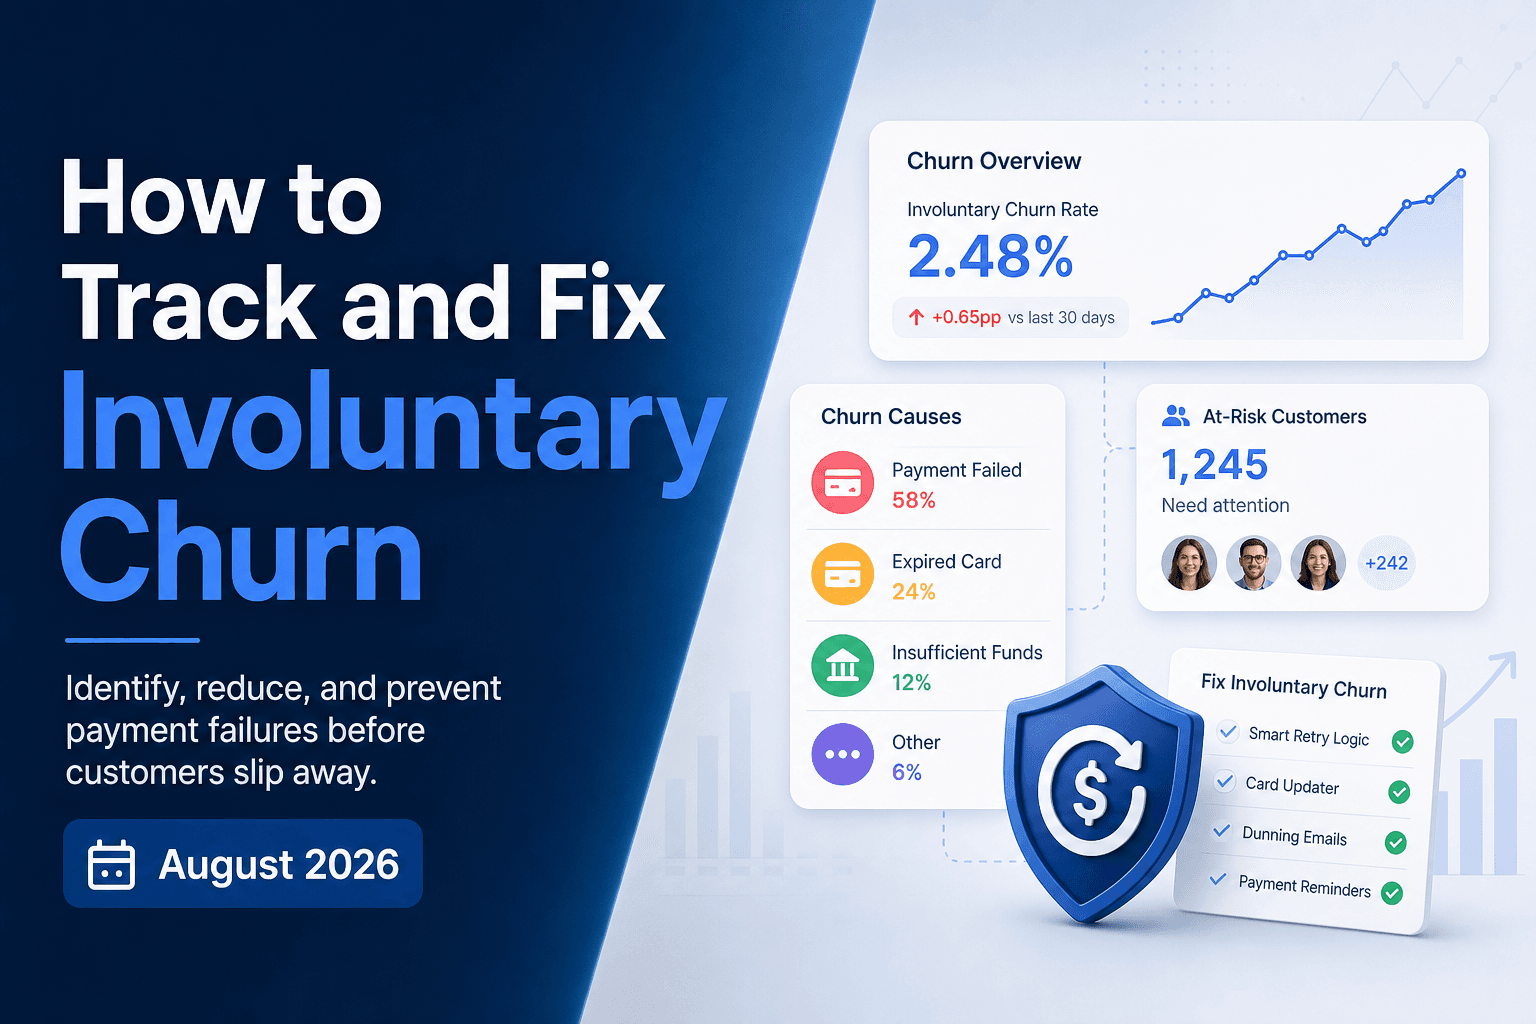
Lumping passive payment failures in with genuine cancellations is one of the most expensive measurement habits in subscription businesses. Your product team ends up chasing a problem that billing infrastructure created, and the revenue sitting in recoverable failures goes untouched. Getting the measurement right is what makes the fix visible.
TLDR:
- Involuntary churn accounts for 20 to 40% of total churn; blended reporting misreads it as a product problem and misdirects budget.
- For a $10M ARR (annual recurring revenue) business, involuntary churn translates to $1 to $2 million lost annually from customers who never chose to leave.
- Only count a subscriber as involuntarily churned after the full retry window closes; counting on first decline inflates your rate with recoverable failures.
- Segment failures by decline code, payment method, geography, tenure, and billing plan; each has a different recovery ceiling and requires a different fix.
- Slicker tracks initial versus final failure rates after the retry window closes, isolating recovery performance in dollars via AABB testing with p-values reported.
Voluntary vs. Involuntary Churn: Two Different Problems
Churn gets treated as one number. It rarely is.
Voluntary churn happens when a customer actively decides to cancel: they found a cheaper option, outgrew the product, or simply no longer need it. That is a retention problem rooted in product-market fit, pricing, or customer success.
Involuntary churn (also called passive churn or delinquent churn) is different. The customer never decided to leave. A payment failed, the subscription lapsed, and they were quietly pushed out. According to churn rate benchmark data from SubJolt, sourced from over 1,000 companies and 15 million subscriptions, involuntary churn is a consistent and material share of total churn across subscription businesses.
The responses to each type are completely different. Voluntary versus involuntary churn demands entirely different playbooks: voluntary churn responds to win-back campaigns and pricing interventions, while involuntary churn responds to smarter payment retries, targeted dunning, and failure-reason analysis. When you report a single churn number, you lose the ability to act on either correctly.
Why Measuring Them Together Distorts Every Downstream Decision
A blended churn number tells you how many customers you lost. It doesn't tell you why, and that distinction drives every decision downstream.
When involuntary churn gets folded into your overall rate, it looks like a product problem. Teams respond by investing in onboarding improvements, feature development, and customer success headcount, all aimed at customers who were actually satisfied. The payment infrastructure that silently pushed them out goes untouched.
The distortion runs deeper than misallocated budget:
- Customer acquisition cost (CAC) calculations assume each lost subscriber represents a genuine product failure, so your CAC benchmarks overstate the cost of real acquisition problems.
- Lifetime value (LTV) projections get compressed by exits that were never real decisions, making your subscriber economics look worse than they are.
- Cohort analysis misreads retention curves, burying the signal that a payment fix, not a product change, would move the number.
Every model built on that blended figure inherits the same flaw. Fix the measurement architecture first, and the downstream decisions follow.
What Actually Causes Involuntary Churn
Not all involuntary churn starts the same way. The failure reason determines whether recovery is possible at all, which makes taxonomy the foundation of any useful measurement.
Soft declines are temporary. Insufficient funds, network timeouts, and processor errors fall here. The card is valid; the conditions just weren't right. Hard declines are permanent: stolen cards, closed accounts, fraud flags. Retrying them wastes attempts and risks card network penalties.
The breakdown matters because, according to payment industry data, the "generic decline" label accounts for around 39% of all failed subscription payments. That code sits cleanly in neither category, and without intelligent classification, a meaningful share of those failures goes unretried when recovery was possible.
Primary failure reasons to track separately:
- Expired or replaced cards, where the customer relationship is intact but the payment method is stale
- Insufficient funds, which are time-sensitive and often recoverable with well-timed retries
- Bank-side fraud flags, which may resolve but require careful retry logic to avoid worsening the flag
- Generic or ambiguous "do not honor" codes, which are the largest single category and the hardest to act on without proper classification
- Spending or velocity limits, which are temporary and often lift within days
Each has a different recovery ceiling. Measuring them as one pool obscures where the revenue is actually sitting.
The Revenue Stake Inside Your Involuntary Churn Number
Passive churn recovery rates and playbook deserves its own revenue math: involuntary churn accounts for 20 to 40% of total churn across subscription businesses, and that fraction is worth separating from the retention conversation entirely.
When a subscriber exits through a failed payment, they take future MRR (monthly recurring revenue) with them just as surely as a voluntary cancel does. But the economics diverge in one key way: that customer never signaled dissatisfaction. The revenue just stopped, with no Net Promoter Score (NPS) response, no cancellation reason, no chance for your retention team to intervene.
The downstream cost compounds because replacing that subscriber requires new acquisition spend; see how to model the hidden cost of failed payments to quantify this against your own ARR. Industry benchmark data puts the average B2B SaaS involuntary churn rate at 0.8% of monthly churn against a 3.5% total churn figure. For a $10M ARR business, that fraction translates to $1 to $2 million walking out annually from customers who already said yes.
For RevOps teams, the reframe is straightforward: involuntary churn is a recoverable revenue number with a ceiling set by how well your payment infrastructure classifies and retries failures. Measuring it separately is what makes that ceiling visible.
How to Calculate Your Involuntary Churn Rate
Three formulas, one principle: only count a subscriber as involuntarily churned after every retry attempt has exhausted. Counting on first decline inflates your rate with recoverable failures.
The Basic Formula
Involuntary churn rate = subscribers lost to payment failure / total subscribers at period start
Run this monthly. "Lost to payment failure" means the subscription was cancelled after the full retry window closed with no successful recovery.
Revenue-Weighted Version
Basic counts treat a $29/month subscriber the same as a $900/year one. The revenue-weighted version corrects that:
Revenue involuntary churn rate = MRR lost to payment failure / total MRR at period start
Your CFO cares about this number. It connects directly to ARR impact and puts the recovery opportunity in concrete dollar terms.
Cohort-Based Approach
Segment your involuntary churn rate by:
- Acquisition channel (organic vs. paid vs. trial conversion), since payment method quality varies meaningfully across these groups.
- Plan type (monthly vs. annual), because card expiry catches up faster on monthly billing cycles.
- Subscriber tenure (first renewal vs. mature subscriptions), as involuntary churn skews toward newer subscribers.
Cohort breakdowns surface these concentrations so you can target retry logic and dunning accordingly.
The Full Involuntary Churn Metric Stack for RevOps Teams
The involuntary churn rate tells you what you lost. It takes a stack of supporting metrics to understand why, and whether your recovery infrastructure is actually working.
Metric | Formula | Business question answered |
|---|---|---|
Payment failure rate | Failed renewal attempts / total renewal attempts | How often is billing breaking at first try? |
Recovery rate | Recovered payments / total failed payments | What share of failures are we actually collecting? |
Revenue at risk | MRR tied to open payment failures | What's the live exposure right now? |
Recovery time | Days from initial failure to successful payment | How long are subscribers sitting in a failed state? |
Two recovery rate definitions are worth separating. Naive recovery rate divides recovered payments by all failed charges, including hard declines that were never retryable. Attempted recovery rate divides recovered payments by recovery attempts only. The latter is the meaningful performance signal, because it measures how well your retry logic works on failures where recovery was actually possible. Conflating the two can make a weak retry system look adequate.
For a Head of Retention, revenue at risk is the most actionable daily metric; pairing it with the right failed-payment analytics dashboard KPIs quantifies what's still in play before the dunning window closes.
How to Segment Involuntary Churn for Root Cause Analysis
Segmenting along five dimensions converts involuntary churn from a reporting metric into a diagnostic system.
By Decline Code
Insufficient funds, expired cards, and generic declines each have different recovery ceilings and require different responses. A failure reason dunning cadence routes each decline type correctly: expired cards need dunning outreach, insufficient funds need well-timed retries, and generic declines need intelligent classification before you can act. Grouping them produces an average that prescribes the wrong fix.
By Payment Method
Consumer debit cards, corporate cards, and digital wallets behave differently under failure. Debit cards skew toward insufficient funds and recover well with payday-aligned timing. Corporate cards often decline due to spending policy limits. Each segment has its own recovery ceiling.
By Geography
Authorization behaviors and payday patterns vary by country. A UK subscriber on monthly pay recovers on a different schedule than a US subscriber paid biweekly. Lumping them into one recovery window misses both.
By Subscriber Tenure
Newer subscribers carry higher involuntary churn. Cards submitted at acquisition tend toward lower quality, with higher rates of prepaid or near-expiry instruments. Mature subscribers fail for different reasons and recover at higher rates. Separating cohorts by tenure reveals whether your problem is acquisition-stage card quality or aging infrastructure.
By Billing Plan
Monthly plans expose you to card expiry more frequently. Annual plans concentrate renewal risk into a single charge. Each warrants a separate failure rate and a separate recovery strategy.
Once you segment across these dimensions, clusters become visible: a spike in insufficient funds failures in a specific market, or higher churn among first-renewal subscribers on consumer debit. Those clusters have specific fixes. The blended number does not.
Involuntary Churn Rate Benchmarks
Benchmarks give you a floor to stand on, not a target to coast at.
Industry benchmark data puts the average B2B SaaS involuntary churn rate at 0.8% out of 3.5% total churn, with healthy businesses keeping that figure below 1 to 2% monthly. industry benchmark data (via Payway) found a 47.6% industry median recovery rate, meaning the typical subscription business recovers fewer than 48 out of every 100 failed payments.
Your own historical baseline is the most reliable benchmark. Involuntary churn benchmarks by industry show where the average sits; your own trend line shows whether your retry logic and dunning are improving. Use external benchmarks to pressure-test whether your rate is structurally high, then measure progress against your own prior periods.
The Most Common Involuntary Churn Measurement Mistakes
Four mistakes account for most of the measurement drift seen across subscription businesses.
Reporting at the transaction level instead of the invoice level inflates apparent failure volume.
Crediting your billing tool's built-in retries alongside your total failure volume distorts recovery rate calculations. If Stripe Smart Retries recovered 30 of your 100 failures before your dunning tool touched them, and you report a 60% overall recovery rate, you cannot tell which system did what. Attribution requires isolating each recovery layer.
The subtlest error is classifying post-failure voluntary cancellations as true voluntary churn. A subscriber who cancels after a confusing dunning email was pushed out by a bad recovery experience, not a product decision. That exit belongs in your involuntary churn analysis because the fix is a billing infrastructure change, not a pricing change.
Each mistake pulls prioritization in the wrong direction, and the revenue consequences compound quietly over time.
How Slicker Tracks and Closes the Involuntary Churn Gap
Slicker's analytics track both initial failure rates and final failure rates after the full retry window closes. The gap between those two numbers is your recovery performance, measured in actual dollars.
The AABB testing in payment recovery methodology isolates Slicker's incremental lift from your existing retry logic with statistical significance. Traffic splits 50/50 between your current system as the control and Slicker as the treatment, with recovered revenue and p-values reported. Slicker's AI-powered retry engine analyzes over 40 variables per transaction to decide whether to retry, when, and how to route each attempt, delivering documented recovery rate uplifts of 4 to 10 percentage points above control groups.
Setup takes under 5 minutes with zero engineering lift. MRR impact tracking is built into the reporting layer, connecting recovery performance directly to the MRR line your CFO monitors, not buried in transaction counts your retention team has to sort through manually.
Final Thoughts on Turning Involuntary Churn Into a Recoverable Revenue Number
The share is material and largely invisible until you separate it from voluntary cancellation in your reporting. Tracking your involuntary churn rate separately, weighting it by MRR, and segmenting by decline code and payment method turns a vague reporting number into a specific recovery target. The ceiling on that recovery is set by how well your infrastructure classifies and retries failures. Get in touch with the Slicker team to see where your current setup leaves money on the table.
FAQs
What should a SaaS RevOps team track to measure involuntary churn recovery?
Track four metrics together: payment failure rate (failed renewal attempts divided by total renewal attempts), recovery rate on attempted failures only (not all declines, including hard ones that were never retryable), revenue at risk from open payment failures, and recovery time in days. The recovery rate split matters most: a naive recovery rate that includes hard declines in the denominator will make a weak retry system look adequate. Run these monthly, segmented by decline code, payment method, and subscriber tenure, so you can see where the recovery ceiling actually sits, not a blended average that prescribes no specific fix.
How does an AI-powered retry system decide when to stop retrying, compared to a configurable rule-based system?
An AI-powered retry system classifies each failure before acting, reading decline codes, network codes, and Merchant Advice Codes to determine whether recovery is possible at all. Hard declines (stolen cards, closed accounts) get stopped immediately; soft declines (insufficient funds, processor timeouts) get retried at timing windows calculated from card type, issuer behavior, and payday patterns by geography. A rule-based system applies fixed calendar logic to all failures regardless of failure reason, burning retry attempts on unrecoverable cards and risking card network penalties. The structural difference is that rule-based systems apply fixed logic to groups, while a genuinely adaptive system makes a per-transaction decision based on that transaction's own signal set.
How do I calculate my involuntary churn rate without counting recoverable failures as lost subscribers?
See the calculation section above. Key rule: only count churn after the full retry window closes, and measure at invoice level, not transaction level.
Stripe Smart Retries vs. a dedicated payment recovery platform: which recovers more revenue?
Stripe Smart Retries uses a fixed retry schedule applied uniformly across all failures; a dedicated platform like Slicker classifies each failure by type, reads Merchant Advice Codes, and calculates retry timing at the hour level based on card type, issuing bank, and payday patterns. Industry benchmark data shows smart retry systems recover 70 to 85% of soft declines compared to 40 to 60% for fixed schedules. Slicker's AABB testing methodology measures the incremental lift over your existing Stripe baseline on your own transaction data, with a control group running Stripe's native retries and a treatment group running Slicker's AI retry logic, so the performance difference is measured in dollars recovered, not vendor-claimed benchmarks.
What percentage of subscription revenue is typically lost to failed payments?
Industry surveys vary, but failed payments commonly represent a high-single-digit share of subscription revenue, with involuntary churn accounting for 20 to 40% of total churn across subscription businesses. For a $10M ARR business, that translates to $1 to $2 million leaving annually from customers who never decided to cancel. The share is higher for lower transaction amounts and varies by payment method mix, but the consistent pattern across subscription businesses is that the number is material and largely invisible until you separate it from voluntary cancellation in your reporting.
Related Articles

Authorization Rate in Subscription Billing: October 2026
There's a number sitting in your payments data that most finance and retention teams never report on separately: the share of renewal charges your issuing...
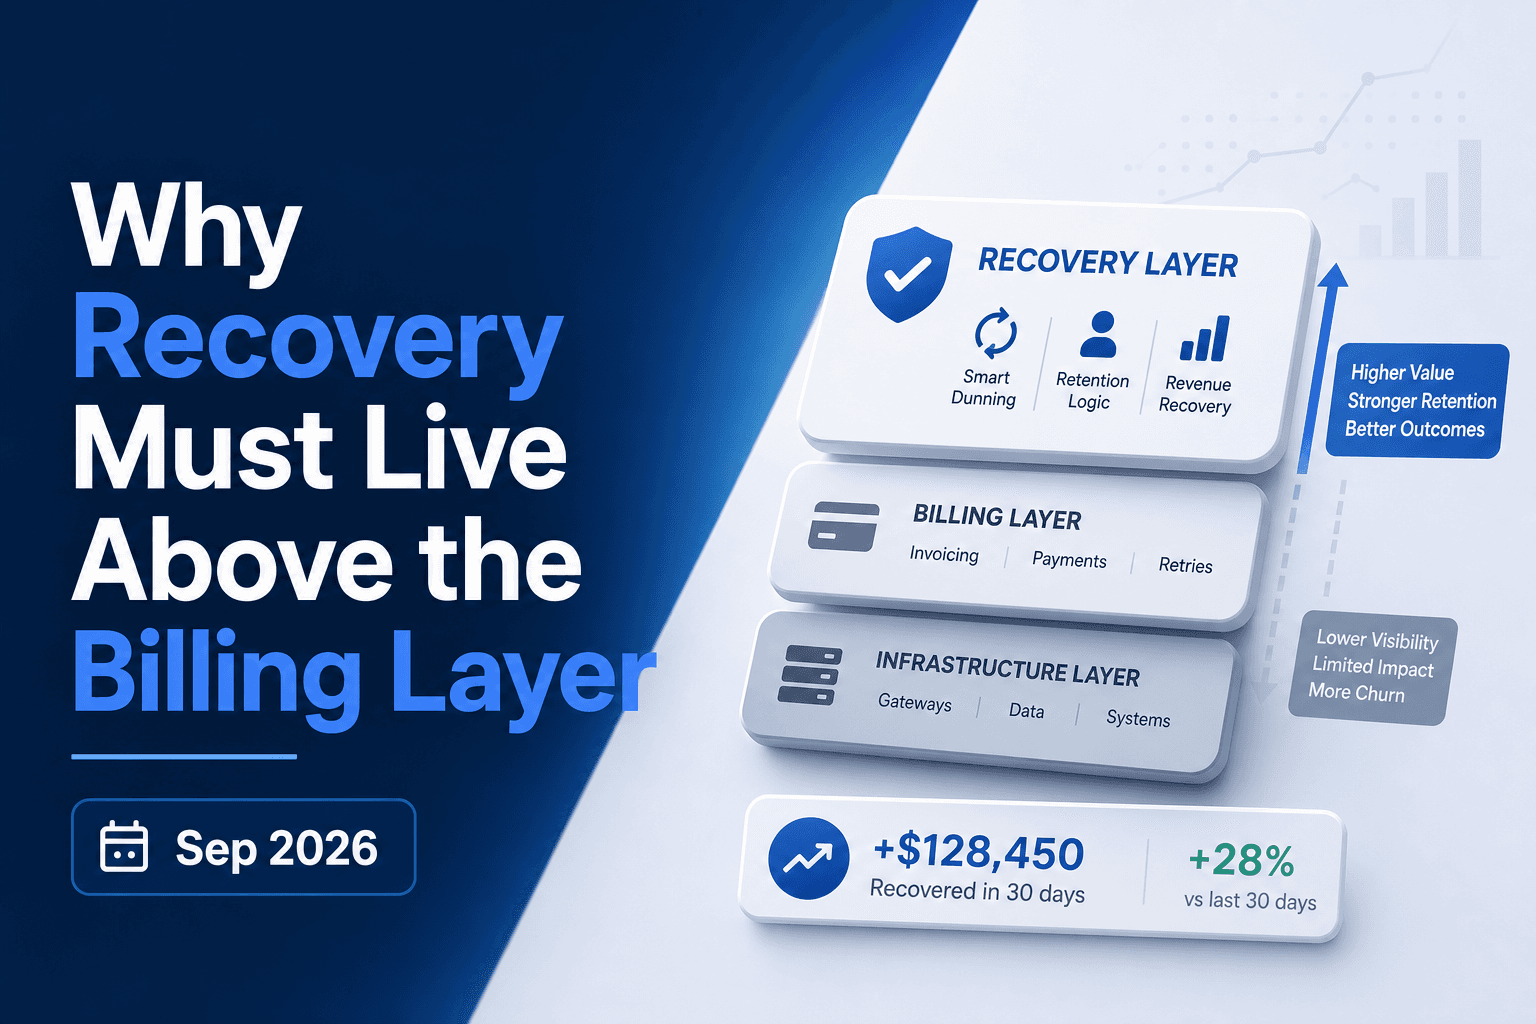
Why Payment Recovery Must Live Above Billers October 2026
A payment fails. Your biller retries it three days later, then again at seven, then at fourteen. What the biller never checks is whether the issuer sent a...
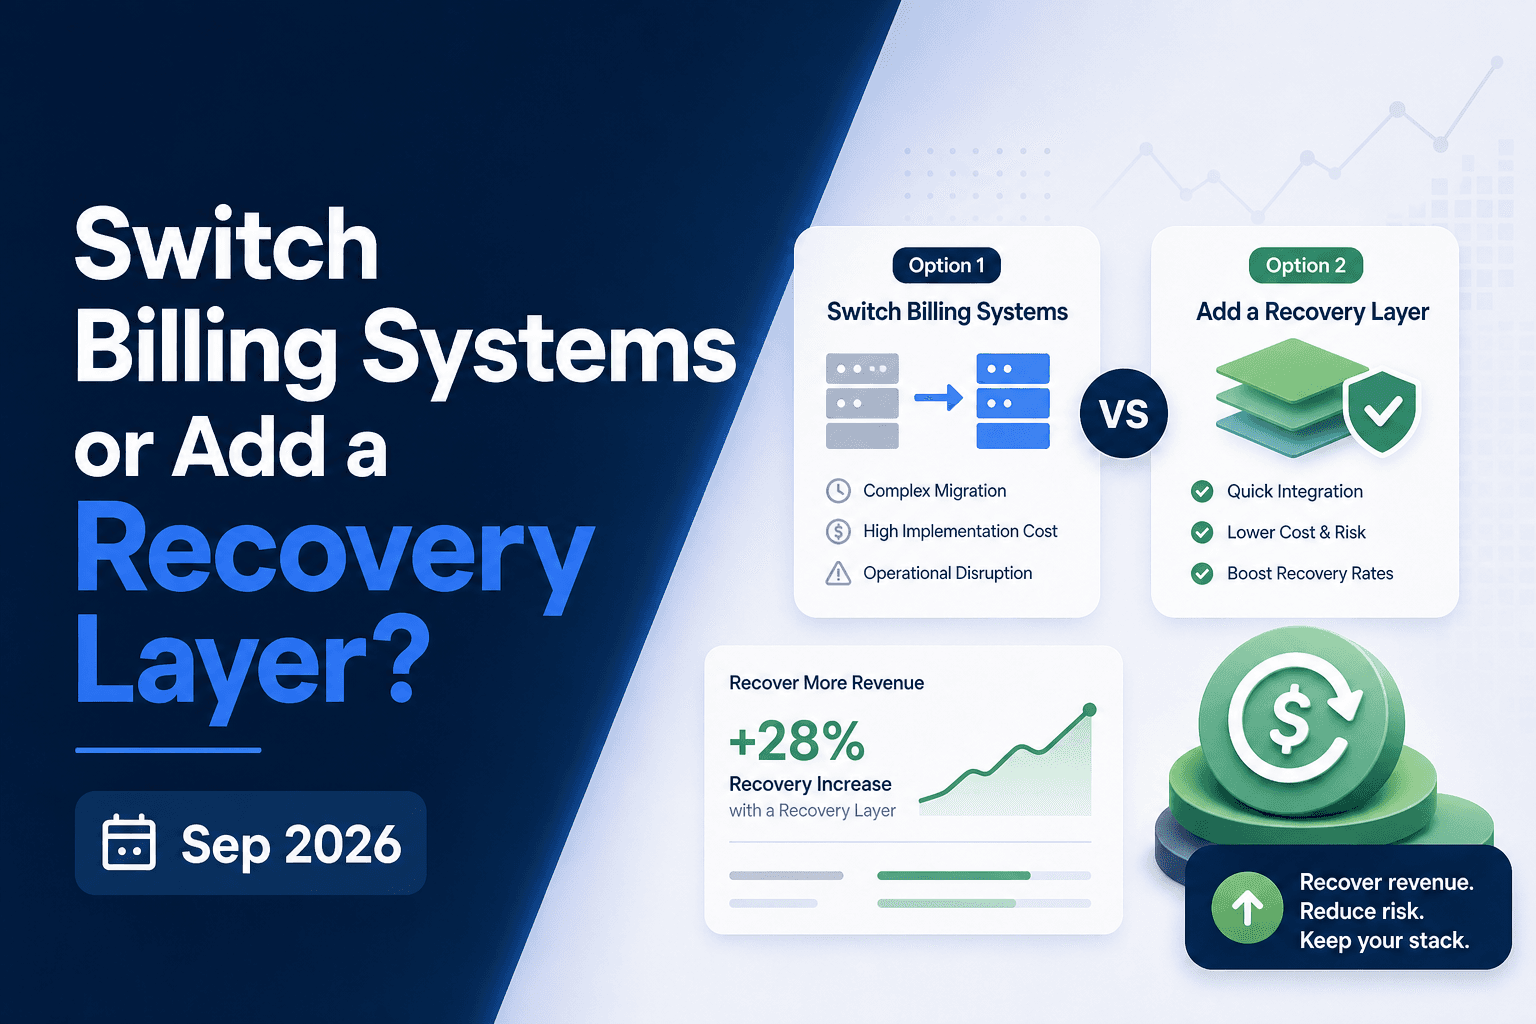
Billing Migration vs Recovery Layer: The Right Call October 2026
Switching billing systems feels like the right move when revenue collection starts breaking down. Sometimes it is. But soft declines, weak retry logic, and...
Stop losing revenue to failed payments
Join leading subscription businesses using Slicker to recover failed payments automatically.
Get Started