Recovery Rate: Your Most Underrated Subscription KPI Oct 2026
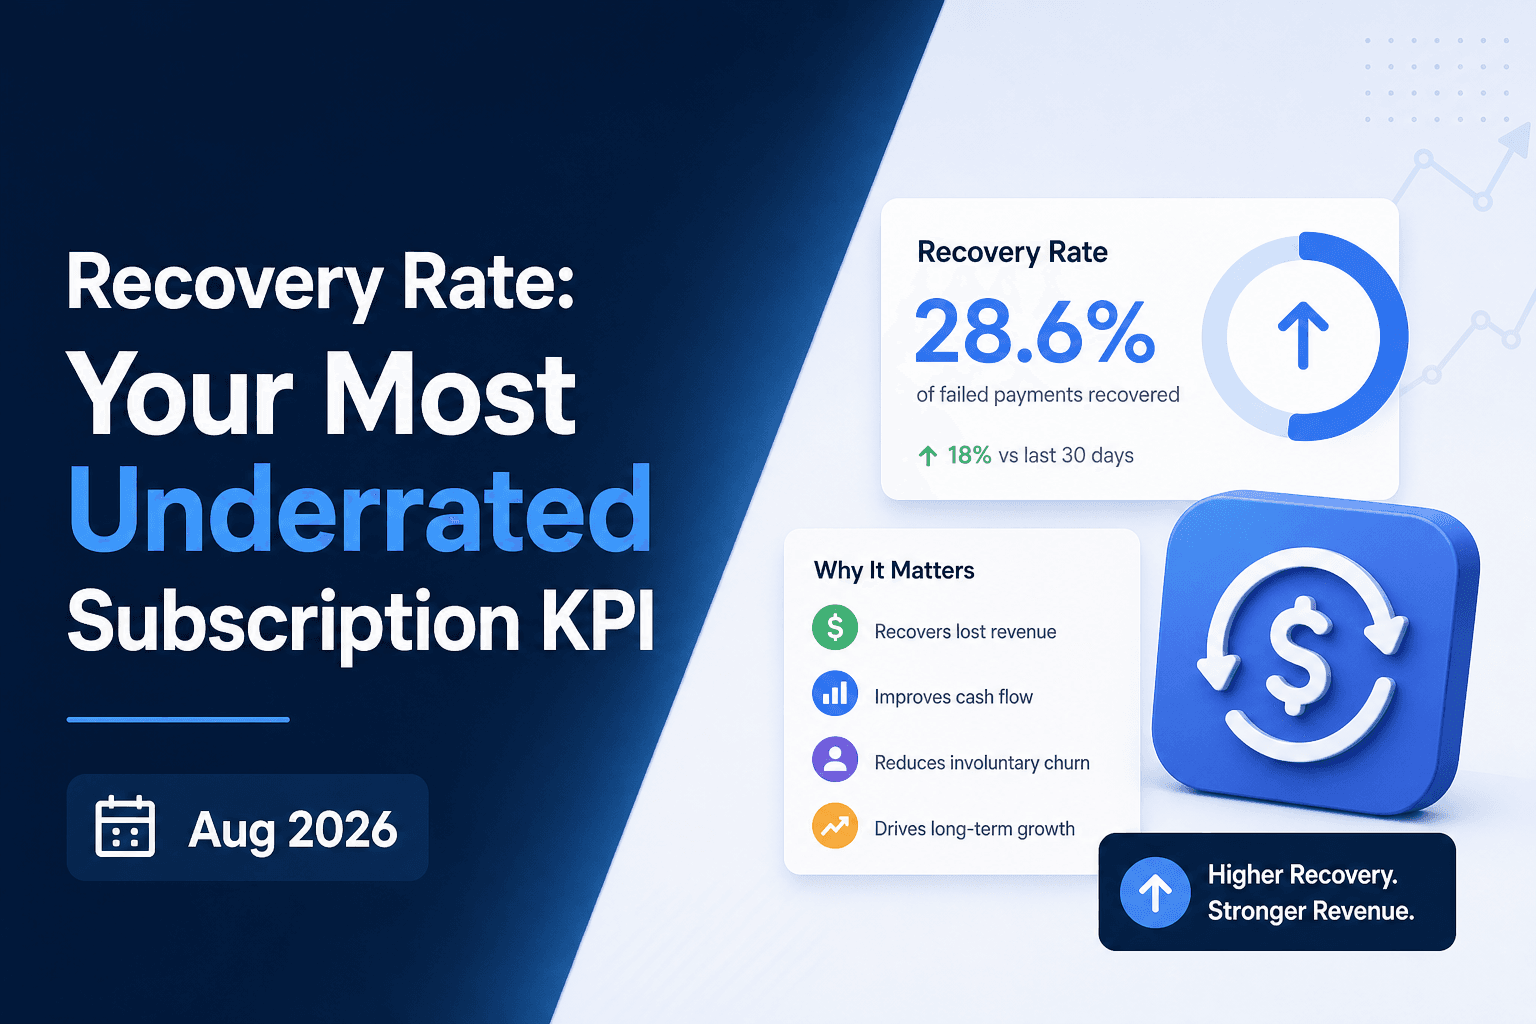
Your churn number is doing something sneaky. It's combining customers who chose to leave with customers whose cards failed and never came back, and those two groups need completely different responses. Recovery rate is what finally separates the two, and once you start tracking it properly, it changes where you point your retention budget.
TLDR:
- Industry data shows 20 to 40% of subscription churn is involuntary, driven by payment failure, not customer intent.
- Recovery rate measures recovered payments divided by failed payments; use "attempted recovery rate" as your denominator or benchmarks mislead you.
- Measure recovery rate monthly on closed cohorts, not weekly; roughly 13% of recovered invoices return in the third week alone.
- Smart retry systems observe 70 to 85% recovery on soft declines; fixed retry schedules typically land between 40 to 60%.
- Slicker measures incremental recovery rate uplift against a controlled baseline using clinical crossover trial design, confirmed before any commercial commitment begins.
Why Recovery Rate Is Invisible on Most Subscription Dashboards
Most subscription dashboards show you one churn number that combines customers who clicked "cancel" with customers whose cards quietly failed. Those two groups require completely different responses, but they land in the same bucket.
Voluntary churn leaves a trail: cancellation flows, exit surveys, win-back sequences. Involuntary churn leaves nothing. The subscriber disappears without ever expressing intent to leave, and the dashboard logs it as a cancellation. Involuntary churn is a distinct problem that most dashboards never surface.
The scale of what goes untracked matters. Industry data shows that 20 to 40% of subscription churn is involuntary, driven by payment failure, not customer intent. Separately, subscription businesses lose around 9% of MRR to failed payments before any recovery effort is applied. If your dashboard never separates these, you have no way to know how much of your churn problem is actually a payments problem.
What Payment Recovery Rate Actually Measures
Recovery rate measures one thing: of the subscription payments that initially failed, what percentage did you collect before the window closed? Expressed as a formula, it's recovered payments divided by total failed payments, within a defined dunning period.
That definition matters because it gets confused with adjacent metrics constantly. Here is how it sits apart from the others:
- Gross renewal rate captures first-attempt success, before any failure occurs.
- Net revenue retention reflects expansion and contraction across your entire base.
- Save rate tracks how often customers reverse an intentional cancellation decision.
Metric | What It Measures | When It Starts Counting | What It Tells You |
|---|---|---|---|
Gross Renewal Rate | First-attempt payment success | Before any failure occurs | How healthy your billing base is on initial charge |
Net Revenue Retention | Expansion and contraction across the entire subscriber base | Ongoing, across all subscribers | Overall revenue growth or shrinkage including upsells and downgrades |
Save Rate | How often customers reverse an intentional cancellation | After a customer initiates cancellation | Effectiveness of win-back and cancellation-flow interventions |
Recovery Rate | Percentage of failed payments recollected within the dunning window | After a payment has already failed | Effectiveness of your post-failure recovery process |
Recovery rate starts counting only after a payment has already failed, making it a purely post-failure metric tied entirely to your recovery process.
A one percentage-point improvement in recovery rate protects MRR (monthly recurring revenue) without a single new acquisition dollar spent, no product change, no pricing experiment. You're recapturing revenue from customers who already said yes.
How to Calculate Recovery Rate Without Misleading Yourself
The formula looks simple: recovered payments divided by total failed payments. In practice, the denominator is where most teams go wrong.
Two versions of this metric exist in the wild:
- Naive recovery rate: recovered payments divided by all failed payments in a period, including hard declines that were never retried, processor-resolved failures that cleared before your system touched them, and payments excluded by policy.
- Attempted recovery rate: recovered payments divided only by payments your recovery system actively worked on.
The naive version understates actual performance by contaminating the denominator with unrecoverable payments. Attempted recovery rate reflects what your process actually did, making it the right metric for benchmarking and vendor comparison.
Timing compounds the problem. Recovery windows typically run 14 to 21 days, so measuring at day seven cuts off in-progress campaigns and produces an artificially low number. Roughly 13% of recovered invoices come back in the third week alone.
When comparing your rate against any external benchmark, confirm both sides are using the same denominator and the same measurement window. Without that alignment, the comparison is meaningless for SaaS financial planning.
Recovery Rate vs. Other Subscription KPIs
Recovery rate sits in a specific place in the key performance indicator (KPI) hierarchy. Payment failure rate is the input: how often do charges fail on first attempt? Recovery rate is what happens next: how much of that failure do you reclaim? Net MRR (monthly recurring revenue) retained and involuntary churn rate are the outputs downstream.
The problem is that most teams only watch the outputs. A stable churn rate looks fine on a board deck, but it can mask a weak recovery process entirely. If 4% of subscribers leave each month and half of those are payment failures that went unrecovered, your retention problem is actually two separate problems requiring two different fixes. Voluntary churn needs product and pricing work. Involuntary churn needs a better recovery process. Treating them as one number produces the wrong diagnosis and the wrong response.
LTV compounds the error. Every involuntary churn event removes a customer who intended to stay, cutting off future subscription revenue that was predictable. A one-point improvement in recovery rate preserves the full remaining lifetime value of each subscriber who would otherwise have been lost to a fixable payment failure.
For CFOs, recovery rate is the leading indicator sitting directly above the MRR protection line. The 7 dashboard metrics CFOs need to track involuntary churn can help you catch this before the month closes. Recovery rate tells you whether you're losing that fight before the month closes, making it a planning input as much as an execution metric.
Payment Recovery Rate Benchmarks
Benchmarks in this area are hard to compare cleanly because most published figures don't specify which denominator they used.
With that caveat, the range is wide. The median recovery rate across subscription businesses sits around 47.6% on naive measurement methodology. Involuntary churn benchmarks by industry show how much that ceiling varies depending on your subscriber mix. Smart retry systems with layered dunning and card account updater services consistently recover 70 to 85% of recoverable failed payments, while top-performing SaaS businesses with favorable failure-type mixes have been observed reaching 80% or higher.
The spread between median and best-in-class comes down to a few variables:
- Soft vs. hard decline mix: businesses with more soft declines (insufficient funds, temporary processor errors) have a structurally higher ceiling because those failures are retryable. Hard declines are not.
- Retry intelligence: fixed schedules fire on a calendar regardless of failure reason. AI-powered retry logic times attempts around issuer behavior, payday patterns, and card type, producing materially better outcomes on the same failure pool.
- Dunning personalization: generic "update your payment method" emails underperform failure-specific messaging that tells the subscriber exactly what action their situation requires.
- Card account updater coverage: capturing card number changes before a retry attempt removes a failure category entirely.
The most reliable benchmark for your business is your own historical baseline. Industry figures give directional orientation, but your failure-type mix, subscriber demographics, and billing infrastructure make external comparisons imprecise.
Why Your Recovery Rate Fluctuates Week Over Week
Recovery rate fluctuates week over week for structural reasons, not because your process is broken.
Three mechanics drive most of the noise:
- Billing cycle clustering: when a large renewal batch fires on the same date and fails, the denominator spikes while recoveries from that cohort haven't landed yet. The rate drops on paper, then rebounds as the dunning window runs its course.
- The error mix changes: a card data breach can replace thousands of cards simultaneously, flooding your failure pool with hard declines that can't be recovered, changing the denominator composition without touching your process effectiveness.
- Recovery windows lag: payments that failed last week are still being recovered this week, so a 7-day snapshot always captures an incomplete cohort.
Stop using weekly recovery rate as your primary diagnostic. Measure it monthly on fully closed cohorts, where the dunning window has expired and the final count is settled. For weekly monitoring, track failed-payment analytics dashboard KPIs like failure rate and error mix breakdown instead. Those update in real time and flag whether something is wrong upstream, before the recovery window closes and the rate firms up.
The Variables That Drive Recovery Rate Up or Down
Four variables determine where your recovery rate lands, and they interact.
The failure type mix sets your ceiling. Soft declines (insufficient funds, processor timeouts) are retryable; hard declines (stolen cards, closed accounts) require cardholder action and cannot be recovered silently. A business with 80% soft declines has a structurally higher ceiling than one with 50%.
Retry timing precision determines how much of that ceiling you actually reach. Retrying an insufficient funds decline an hour after failure repeats the same result. Retrying around payday deposit windows changes the authorization probability materially.
Card account updater services (Visa Account Updater, Mastercard Automatic Billing Updater) remove expired card failures before they enter the recovery funnel at all, shrinking the denominator instead of improving the numerator.
Dunning personalization determines what happens when silent recovery fails. An expired card needs a card update request; an insufficient funds decline needs a different message entirely. A failure reason dunning cadence routes each decline correctly instead of treating both the same.
How to Segment Recovery Rate for Actionable Insight
A single recovery rate hides more than it reveals. Segmenting it exposes which subscriber cohorts, failure types, and payment methods are dragging the aggregate down.
The most useful cuts:
- Failure reason: insufficient funds, expired cards, and fraud blocks each have different recovery ceilings and require different strategies. Grouping them obscures which problem you're actually solving.
- Payment method: prepaid and debit cards tied to payroll cycles have different optimal retry windows than corporate credit cards. Recovery logic that ignores this leaves money on the table.
- Billing plan: annual subscribers represent higher LTV, which supports a longer dunning window than a monthly subscriber approaching their second renewal.
- Customer tenure: a subscriber with 24 clean payment cycles warrants more aggressive recovery than a first-cycle subscriber whose intent is unproven.
- Geography: US biweekly payroll and UK monthly payroll produce different retry windows. Treating them identically misaligns attempts with actual fund availability.
- Brand or sub-product: when one billing account spans multiple products, aggregate recovery rate can mask that a single product's subscriber mix is suppressing the overall figure.
How to Measure the True Business Impact of Your Recovery Rate
Start with MRR at risk: multiply your monthly MRR (monthly recurring revenue) by your failure rate to get the dollar volume entering the recovery funnel each month. A hidden cost of failed payments model can help you run this calculation precisely. Apply your current recovery rate to see what you're saving. The gap between that figure and the theoretical ceiling is revenue you're leaving behind.
Per-transaction math understates the real number. A recovered subscription isn't one payment; it's the customer's remaining lifetime value. Recovering a subscriber on a $50/month plan with 18 months of expected tenure is worth $900, not $50.
For incremental measurement, you need a control group. Some failed payments self-resolve regardless of what your recovery system does. Without a baseline, you're crediting your recovery tool for recoveries that would have happened anyway. Knowing how to measure subscription churn rate correctly is what makes that controlled baseline meaningful, and that's the number worth building a business case around.
How Slicker Approaches Payment Recovery Rate
Slicker treats recovery rate as a provable number, not a reported one. Most systems surface an aggregate recovery rate with no way to separate what they caused from what would have happened anyway. A controlled baseline is the only defensible denominator.
The methodology is borrowed from clinical crossover trial design. Failed payment traffic is split into control and treatment cohorts, recovery is measured in actual dollars, and a p-value confirms statistical significance before any commercial commitment begins. The output is not your overall recovery rate but the incremental lift Slicker produces over your own existing baseline.
The mechanics behind that lift are specific. Our ensemble of AI models analyzes over 40 variables per transaction, including card type, issuing bank behavior, geography, payday cadence, and time of day, to set optimal retry timing. In AABB-validated customer pilots, control groups required 4.4 retry attempts per failure on average versus 6.1 for naive retry schedules (customer data on file). Smart retry systems operating on this approach consistently reach 70 to 85% recovery on recoverable soft declines, compared to 40 to 60% for fixed retry schedules.
The pilot keeps verification risk-free: the first month is free, three paid months follow with the option to cancel anytime. Recovery rate uplift is confirmed on your own data before payment begins.
Final Thoughts on Payment Recovery Rate and What It Reveals About Your Retention Strategy
If your dashboard shows one churn number, you are making retention decisions with half the picture. Payment recovery rate gives you the other half, and the math on what it protects is straightforward once you measure it correctly. Segmenting by failure type, closing your cohorts at the full dunning window, and using the right denominator are the three moves that turn this from a reported number into an actionable one. Connect with the Slicker team to see the incremental lift your recovery process is leaving behind.
FAQs
What's the best way for a SaaS CFO to measure whether a payment recovery process is actually working?
The only reliable measure is incremental lift over a controlled baseline, not your overall recovery rate. Some failed payments self-resolve regardless of what your recovery system does, so without a control group you're crediting your tool for recoveries that would have happened anyway. Split failed payment traffic between your existing process and the recovery system under review, measure actual dollars recovered in each cohort, and confirm statistical significance before drawing conclusions.
How do merchant advice codes affect whether and when to retry a failed subscription payment?
Merchant Advice Codes (MACs) give card networks a way to signal the recommended action after a decline: wait 24 hours (MAC 25), wait 10 days (MAC 30), stop retrying entirely (MAC 03), or indicate that updated account information is already available through the network's card account updater service (MAC 01 - this is a network-side signal, not an instruction to contact the cardholder). The complication is that following MAC guidance literally can hurt recovery. If a MAC prescribes a 10-day wait but your dunning window closes in five days, you lose the subscriber by complying. A well-designed retry system treats MACs as one input among many, alongside card type, issuer behavior, and subscriber history, not as absolute instructions.
What causes week-over-week spikiness in payment recovery rates, and how should you track the metric more consistently?
Three mechanics drive most of the volatility. Large billing batches fire on the same date, spiking the denominator while recoveries from that cohort haven't landed yet. Card portfolio events like a data breach can flood your failure pool with hard declines overnight, changing the denominator composition without reflecting any change in your process. And recovery windows typically run 14 to 21 days, so any snapshot shorter than that captures an incomplete cohort. Measure recovery rate monthly on fully closed cohorts where the dunning window has expired. For weekly monitoring, track failure rate and error mix breakdown instead, since those update in real time and flag upstream problems before the window closes.
What are best practices for retrying failed subscription payments without hurting your merchant reputation?
Stop retrying hard declines immediately. Visa caps retries at 15 attempts within 30 days per card; Mastercard allows 10 within 24 hours on soft declines (per Visa's retry guidelines and Mastercard's authorization rules; verify current thresholds on each network's developer portal, as these figures change periodically). Exceeding those thresholds triggers penalties ranging from $1 to $25 per excessive retry, and repeated attempts on stolen or closed accounts damage your merchant ID's authorization rate on future legitimate charges. The practical rule: classify the failure before acting. Soft declines (insufficient funds, processor timeouts) are retryable with the right timing. Hard declines (stolen card, closed account, fraud block) require cardholder action and should stop your automated retry immediately.
Why does recovery rate differ across brands or sub-products within the same subscription business?
The failure type mix is usually the answer. A sub-product attracting a higher share of prepaid or debit cards will see more insufficient funds declines, which lowers the recoverable ceiling compared to a product whose subscribers pay with corporate credit cards. Acquisition channel also matters: subscribers who signed up through a discounted trial or a partner bundle tend to have weaker payment credentials than direct subscribers, producing structurally higher failure rates and lower recovery ceilings. Segmenting your recovery rate by brand, payment method, and acquisition source reveals which problem is a billing infrastructure issue and which is an acquisition quality issue, and those require different fixes.
Related Articles

Authorization Rate in Subscription Billing: October 2026
There's a number sitting in your payments data that most finance and retention teams never report on separately: the share of renewal charges your issuing...
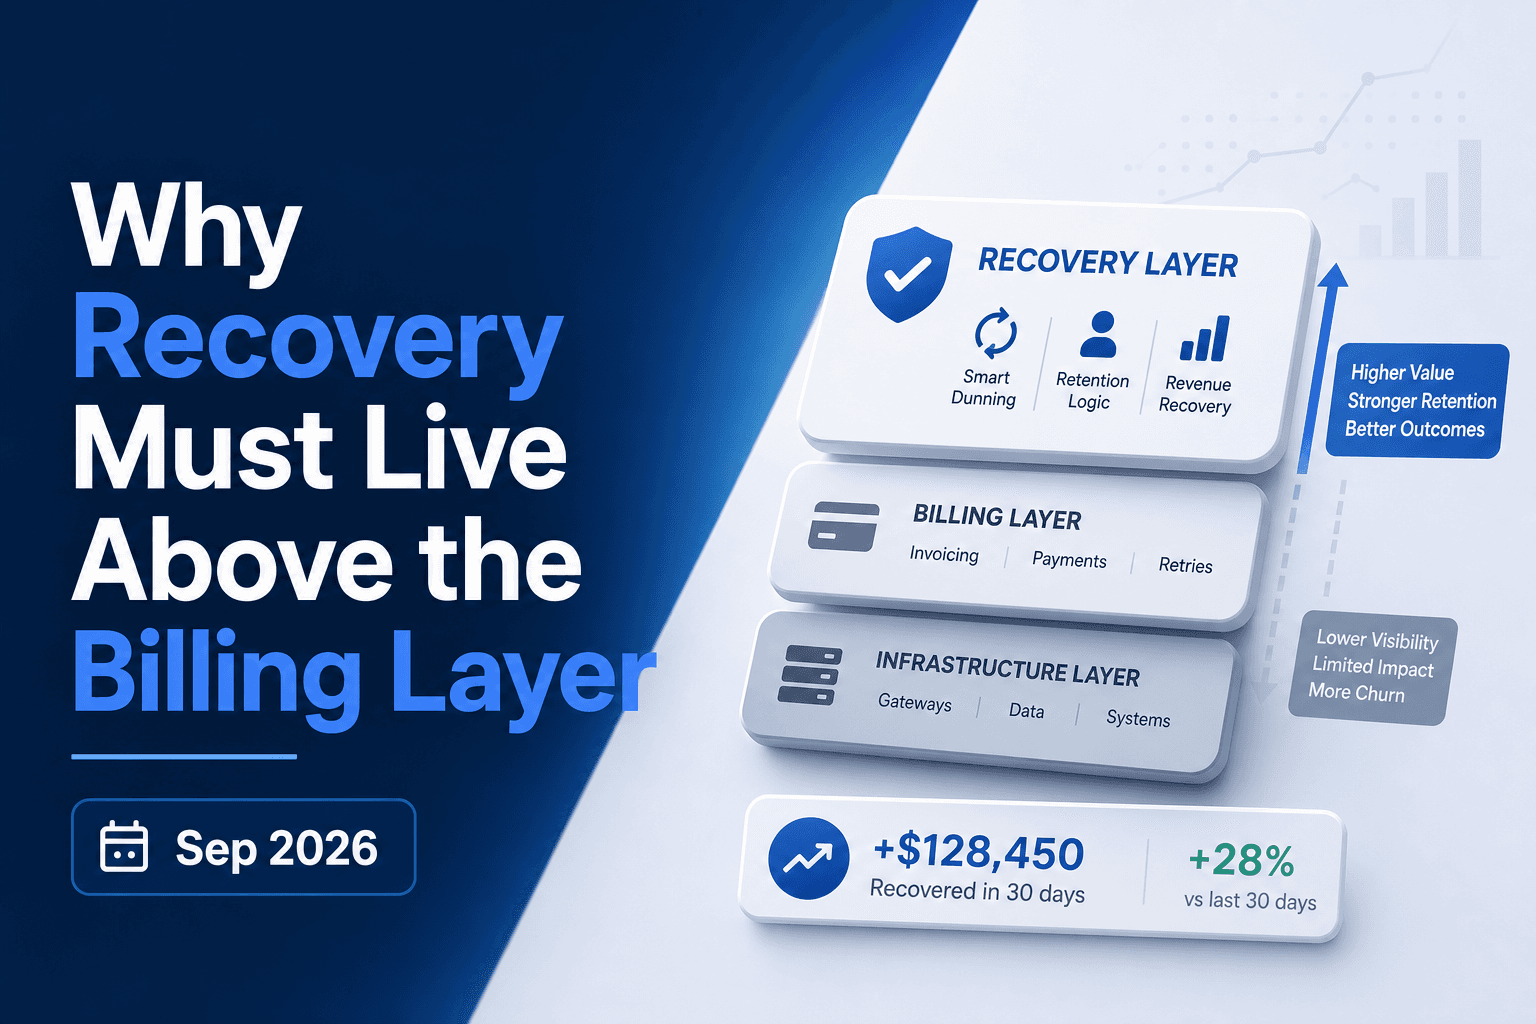
Why Payment Recovery Must Live Above Billers October 2026
A payment fails. Your biller retries it three days later, then again at seven, then at fourteen. What the biller never checks is whether the issuer sent a...
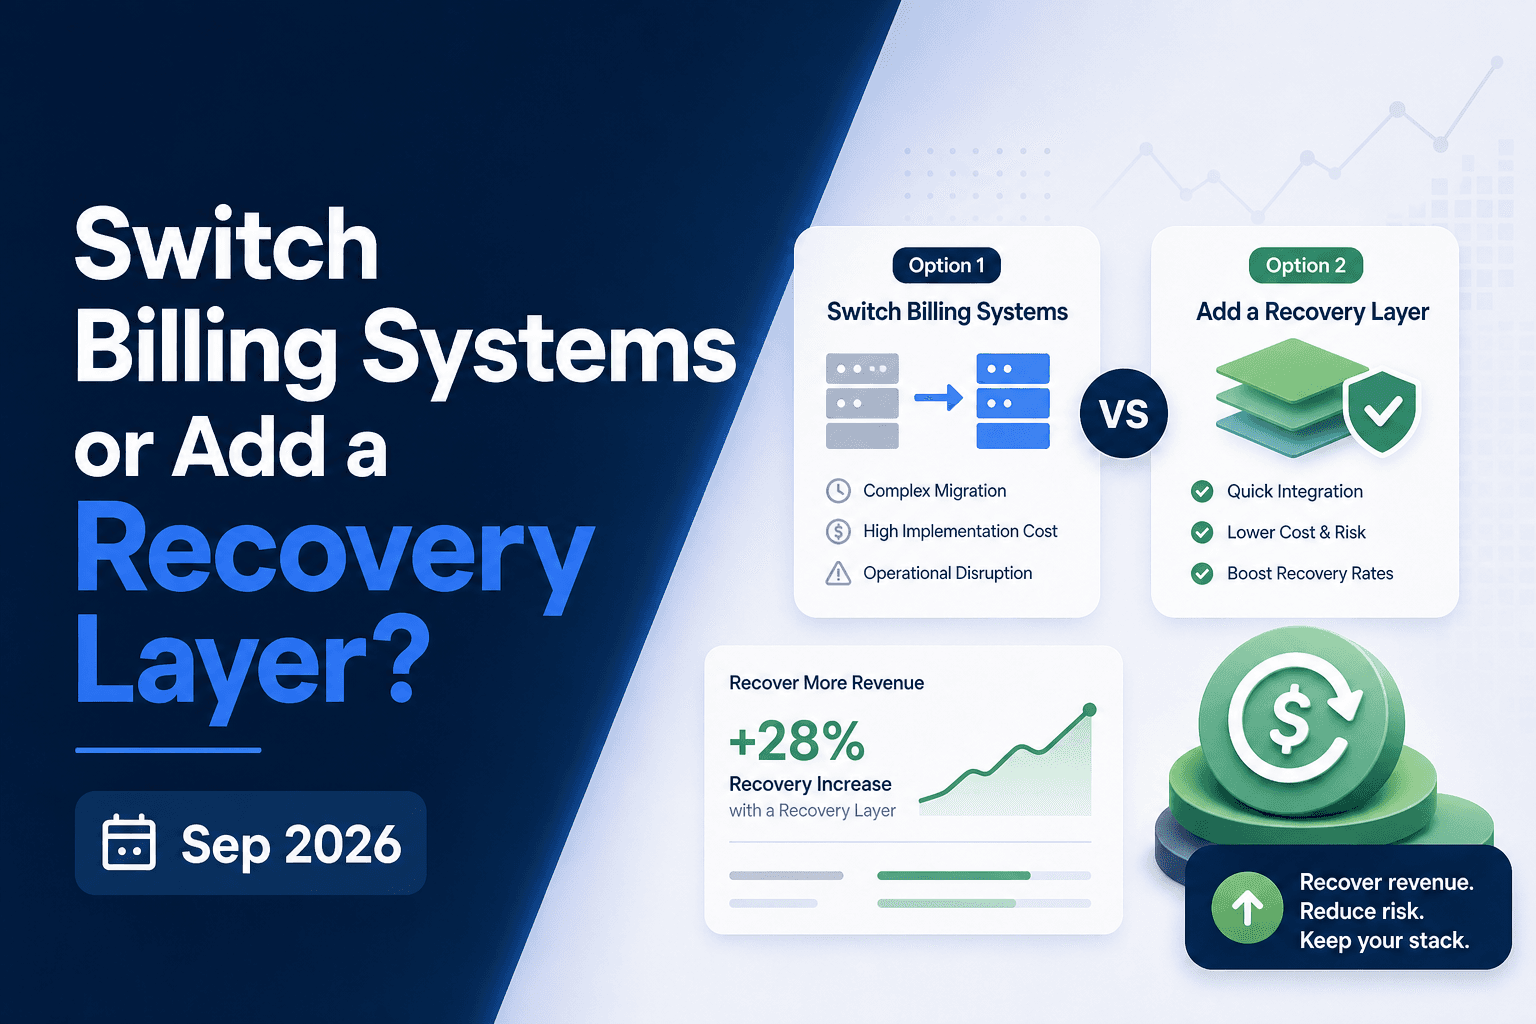
Billing Migration vs Recovery Layer: The Right Call October 2026
Switching billing systems feels like the right move when revenue collection starts breaking down. Sometimes it is. But soft declines, weak retry logic, and...
Stop losing revenue to failed payments
Join leading subscription businesses using Slicker to recover failed payments automatically.
Get Started