Involuntary Churn Is Draining Your LTV (October 2026)
If your monthly churn sits around 6% and you're pouring budget into win-back campaigns, there's a good chance you're solving for the 3% while the other 3% quietly walks out because a card failed at 2am. Understanding the difference between voluntary vs involuntary churn LTV impact is what separates a patched retention funnel from one that actually holds.
TLDR:
- Failed payments drive roughly 48% of subscription churn, yet most billing dashboards report it identically to voluntary cancellations.
- Involuntary churn penalizes your LTV formula with a problem that payment recovery can fix; moving from 5% to 3% monthly churn adds ~13 months of average customer lifetime.
- Voluntary churn strategies like cancel flows and win-back campaigns have zero effect on failed-payment exits; they require separate payment infrastructure responses.
- Industry data shows smart retry systems recover 70 to 85% of soft declines versus 40 to 60% for fixed schedules, a gap that maps directly to longer customer lifetimes and higher LTV (customer lifetime value).
- Slicker applies an ensemble of AI models across 40+ variables per transaction to close the gap between what your LTV model assumes and what involuntary churn actually delivers.
Voluntary vs. Involuntary Churn: Two Different Problems
Voluntary churn is a decision. The customer weighed the value, found it lacking, and left. Involuntary churn is something else entirely: a payment fails, access gets cut, and a subscriber who had no intention of leaving simply disappears.
These two problems share a metric but nothing else. One is a product or positioning failure. The other is a payment infrastructure failure. Treating them with the same playbook wastes budget and misses the actual leak.
Voluntary Churn | Involuntary Churn | |
|---|---|---|
Cause | Customer cancels intentionally | Payment fails; subscriber is removed |
Customer intent | Wants to leave | Wants to stay |
Signal | Cancellation event, low NPS, support tickets | Failed payment, dunning bounce, silent drop-off |
Fix | Retention offers, product improvement, pricing changes | Smart retries, dunning emails, payment recovery |
LTV impact | Recoverable with re-engagement | Recoverable with payment recovery alone |
Industry data shows failed payments account for roughly 48% of all subscription churn. If your dashboard shows 6% monthly churn and you pour resources into win-back campaigns and cancellation flows, you may be solving for the 3% while ignoring the other 3% that payment recovery could have closed quietly, without the customer ever knowing there was a problem.
Why Involuntary Churn Is Underreported in Most Subscription Metrics
Most billing dashboards report a single churn number. Cancellations, failed payments, expired cards that never got updated: all collapsed into one rate. That number lands in a board deck labeled "customer churn," and the room immediately starts debating product quality and NPS.
The problem is structural. When a billing system cancels a subscription after a failed payment, it often records that event identically to a deliberate cancellation. Finance sees churn. Leadership sees a retention problem. No one asks how many of those customers actually chose to leave.
A PYMNTS study of 200 subscription businesses found that roughly 48% of all subscription churn results from failed card payments, 80% of which are unrelated to anything the customer did or could control. That's payment infrastructure generating churn that looks, in your metrics, indistinguishable from someone who clicked "cancel."
Without separating failed-payment exits from active cancellations, retention spend flows toward win-back campaigns and offboarding surveys for customers who had no intention of leaving, while the actual cause compounds billing cycle after billing cycle.
How Churn Type Changes the LTV (Customer Lifetime Value) Formula
LTV has a straightforward relationship with churn. As ChurnZero explains, customer lifetime equals 1 divided by your churn rate. At 5% monthly churn, the average customer stays 20 months. At 3%, they stay 33 months. That gap compounds directly into lifetime revenue.
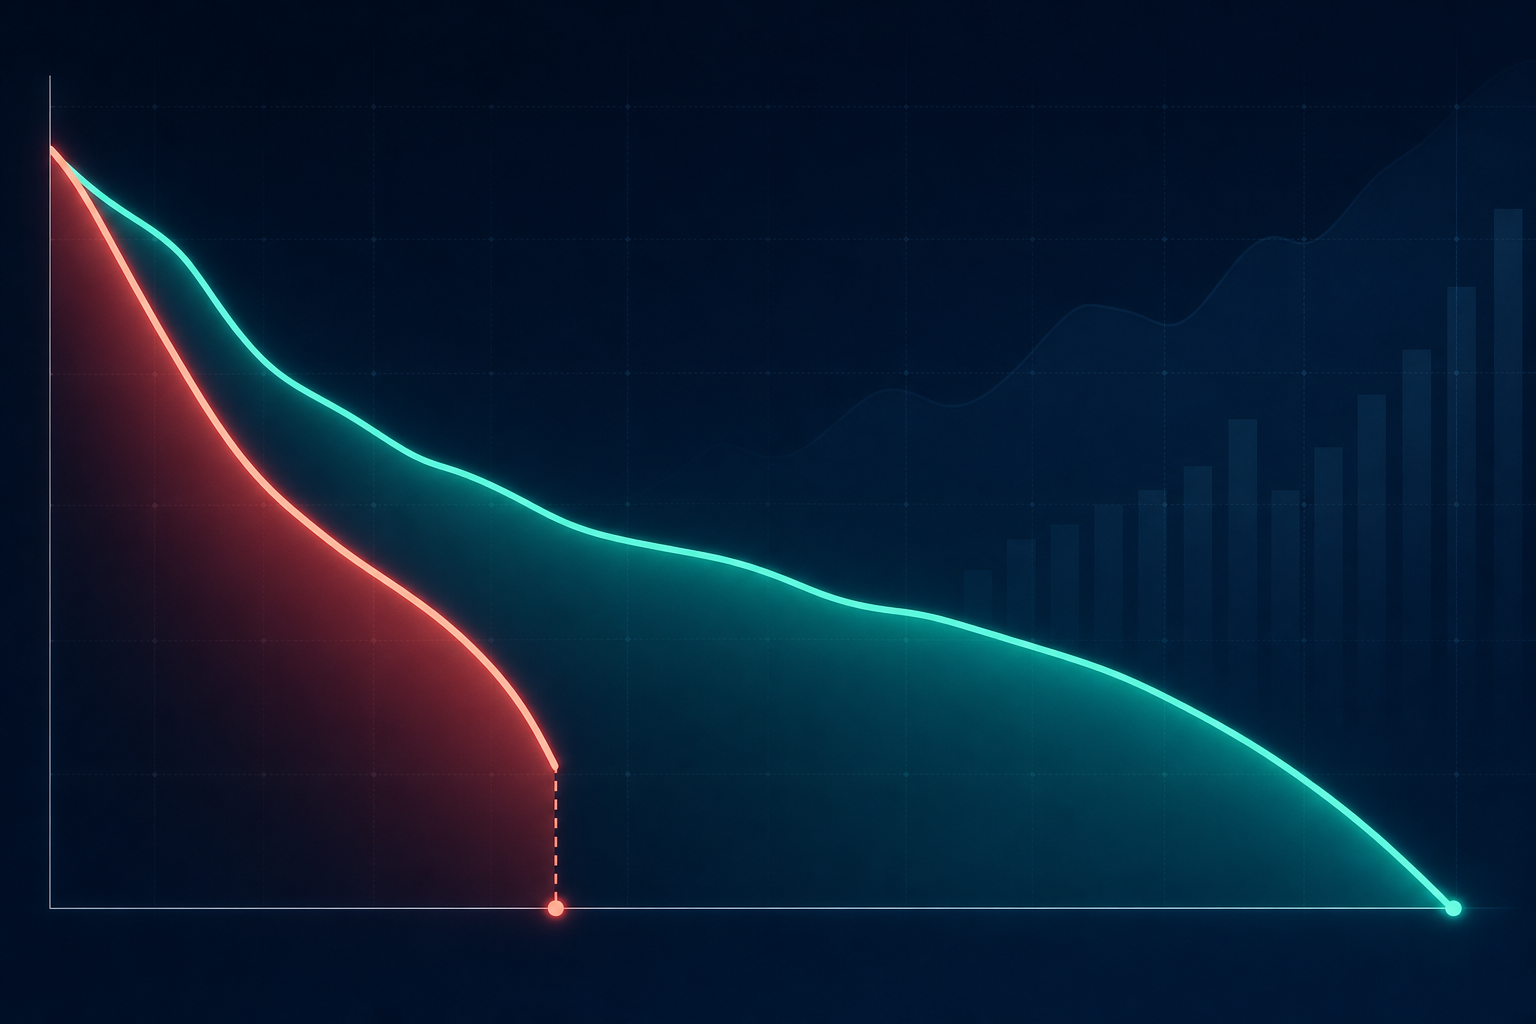
If 2 of those 5 percentage points come from failed payments, your LTV calculation is penalized by a problem you can actually fix. You haven't lost those customers to a pricing or product failure. You've lost them to recoverable payment infrastructure gaps.
Fixing involuntary churn extends customer lifetime purely by keeping paying customers on the books who intended to stay, with no product changes, repricing, or onboarding overhaul required. For a $50 monthly subscription business, moving from 5% to 3% monthly churn adds roughly 13 additional months of average customer lifetime (using the 1 divided by churn-rate formula above). See involuntary churn rate SaaS benchmarks to gauge where your numbers stand. That's LTV expansion without touching a single growth lever.
The CAC (Customer Acquisition Cost) Problem No One Talks About
CAC assumes time. The whole model depends on a customer staying long enough that their lifetime revenue exceeds what you spent acquiring them. When involuntary churn cuts that lifetime short, the acquisition cost doesn't shrink with it.
A customer acquired for $200 who churns after three months on a $40 plan generated $120. You're $80 short, and they didn't even want to leave. Every dollar spent on paid media, sales cycles, or onboarding for that subscriber contributed to a negative return, not because your acquisition was wrong, but because a payment failure ended the relationship before customer acquisition cost (CAC) payback cleared.
This hits the LTV:CAC ratio from both directions. Involuntary churn lowers LTV by shortening average customer lifetime, while CAC stays fixed. A ratio that looked healthy at 3:1 across your full subscriber base may be masking a cohort of failed-payment exits that never crossed payback. Your acquisition channel didn't underperform. Your payment recovery did.
What Actually Causes Involuntary Churn
Involuntary churn traces back to a small set of root causes, but how you respond depends entirely on which one you're dealing with.
The most common triggers:
- Expired or replaced cards where the customer updated their wallet but not their billing profile
- Insufficient funds at the moment of the charge cycle
- Bank-side fraud flags blocking a legitimate recurring charge
- Generic "do not honor" codes where the issuer declines without explanation
- Out-of-date billing information after a card is lost, reissued, or closed
The critical distinction is between soft declines and hard declines. Soft declines, like insufficient funds or a network timeout, are temporary. The card is valid; the timing is wrong. Hard declines, like a stolen card or a closed account, are permanent. Retrying them wastes attempts, risks card network penalties, and can damage your merchant reputation.
Every downstream recovery decision flows from that classification. Retrying a soft decline at the right moment recovers the subscriber silently. Retrying a hard decline burns retry attempts and can trigger Mastercard's $0.10-per-retry fee (per Mastercard's merchant advice code framework), charged on every attempt made after the issuer has already returned MAC Code 03 ("Do Not Try Again").
The exposure varies by business model. Subscription boxes see as much as 68% of their churn driven by failed payments, not active cancellations. B2C apps and SaaS businesses face different ratios, but the failure categories remain the same.
Why Voluntary Churn Strategies Don't Fix the Involuntary Problem
Cancel-flow optimization, exit surveys, and customer success outreach all rest on one assumption: the churning subscriber made a choice. You can offer a discount, surface a missed feature, or smooth offboarding. None of that reaches someone whose payment failed at 2am and whose access was cut before they noticed anything was wrong.
Product improvements don't fix expired cards. Win-back campaigns reach someone after removal, requiring re-acquisition of a subscriber who never consciously left. You've turned a recoverable payment event into a lapsed customer problem, and lapsed customers are far harder to re-engage than ones who simply need a retry at the right moment.
The investment mismatch compounds over time. Resources committed to voluntary churn reduction have no impact on the failed-payment cohort. That cohort requires payment infrastructure responses: decline-code classification, retry timing tuned to payday cycles and card type, and dunning outreach only when customer action is genuinely the only recovery path. A passive churn recovery playbook covers each of these steps in detail. These are different systems and different vendor relationships than anything in a traditional retention stack.
Leaving involuntary churn unaddressed while optimizing voluntary churn is a budget allocation problem as much as a technical one. The recoverable revenue gap stays open every billing cycle, compounding quietly while the retention team celebrates improvements in cancellation rates.
How to Calculate Your Involuntary Churn Rate
Pull every cancellation event from your billing system for a given month, then filter by reason: separate payment-failure exits from active cancellations. For a full walkthrough, see how to measure subscription churn rate. Billing systems like Chargebee, Recurly, and Stripe Billing log the cancellation trigger. Failed-payment exits appear as dunning exhaustion events or unpaid invoice closures, not explicit customer cancellations.
One important distinction: count lost subscribers, not failed attempts. If a card fails four times before an account closes, that's one involuntary churn event.
The denominator matters too. Use your active subscriber count at the start of the period to keep the rate comparable month over month.
To size this in revenue terms, multiply your involuntary churned subscriber count by average monthly revenue per subscriber, then annualize. For a $10M ARR business where 2% of monthly churn is involuntary, that's roughly $200k leaving each month through a gap that payment recovery can close, without a single product change or retention campaign.
The KPIs That Actually Measure Involuntary Churn
Headline churn rate tells you how many subscribers left. It says nothing about how many of those exits were preventable, how well your retry logic performed, or whether your dunning window was long enough. These four metrics close that gap.
- Initial payment failure rate vs. final failure rate: the difference between how many payments fail on the first attempt and how many remain unrecovered after your full retry period. A wide gap means your recovery stack is working. A narrow one means retries are not pulling their weight.
- Recovery rate on soft declines: the percentage of retryable failures resolved before the subscription closes, and the clearest measure of retry logic performance.
- Failed-payment analytics dashboard KPIs (2025 benchmarks) frame recovery in terms your CFO cares about, including revenue recovered as a share of MRR (monthly recurring revenue). A 2% involuntary churn rate lands differently when you can show it represents 1.8% of MRR and that recovery is closing 60% of that gap each cycle.
- Gross churn vs. net churn: gross churn counts all exits before any recovery; net churn reflects what remains after retries and dunning. Reporting only net churn hides how much work the payment stack is doing.
If your final failure rate sits close to your initial failure rate, the problem is recovery infrastructure. If gross and net churn diverge meaningfully, that delta represents revenue your payment stack is actively protecting.
How Acquisition Quality Shapes Involuntary Churn Risk
Not all subscribers carry the same payment risk, and that gap shows up directly in your involuntary churn rate by cohort.
Cards submitted during free-trial signups skew toward prepaid cards, virtual card numbers, and low-balance debit accounts, all of which are structurally more likely to fail at first charge. A subscriber who enters a paid credit card at checkout is a different risk profile than one who bypassed payment friction during a free trial.
Acquisition channel compounds this. Organic search converts customers who actively sought out your product. Paid social campaigns optimized for signup volume pull in higher-risk payment profiles.
Why This Distorts Your Recovery Benchmarks
If two acquisition channels show similar conversion rates but one generates involuntary churn at twice the rate, the problem is card quality at the source, not your retry logic. Tracking the right CFO dashboard metrics for involuntary churn surfaces these cohort differences early. A cohort heavy with prepaid and virtual cards has a structurally lower recovery ceiling. Smarter retries still help, but the baseline failure rate sits upstream of your billing stack entirely.
Segment your involuntary churn by acquisition channel and payment method type before drawing conclusions about whether your recovery infrastructure is underperforming. Without that segmentation, you risk optimizing the wrong variable while the real revenue leak goes unexamined.
Recovery Strategies That Work on Involuntary Churn
Four levers move the needle on involuntary churn recovery, and they compound when used together.
Smart retry timing is the highest-impact starting point. Fixed retry schedules fire on a calendar regardless of why the payment failed. Intelligent payday retries read the decline code first, then time attempts around payday cycles, card-type behavior, and issuer-specific authorization windows. Industry data shows smart retry systems consistently recover 70 to 85% of soft declines; fixed retry schedules typically land between 40 to 60%. That gap is a direct LTV difference: every subscriber pulled back from the failed-payment cohort adds months of lifetime revenue back into the formula.

The Other Three Levers
Beyond retry timing, three more recovery methods extend what you can recapture.
- Card account updater services run in the background before a charge even attempts, refreshing expired or reissued card details through Visa and Mastercard's network programs. Recoveries that happen before a decline ever registers are the cleanest possible outcome.
- Dunning email sequences handle what retries cannot. When a hard decline requires cardholder action, a message tied to the specific failure reason outperforms any generic "update your payment method" blast.
- Multi-payment-method orchestration extends the recovery window further by routing retry attempts across all payment instruments on file, instead of exhausting attempts on a single failing card.
Each lever recaptures revenue you already earned from subscribers who already said yes.
How Slicker Approaches the LTV-Involuntary Churn Gap
Slicker was built to close the gap between what your LTV (lifetime value) model assumes and what involuntary churn actually delivers. The core problem is precision: fixed retry schedules cannot distinguish a payday timing issue from a closed account, and they do not know that a US consumer debit card authorizes most reliably at 12:01am when payroll clears.
An ensemble of AI models analyzes over 40 variables per transaction, including card type, issuing bank, geographic payday cadence, and hour-level authorization windows. Retry decisions are made per individual transaction, not per customer segment. Industry data shows smart retry systems consistently recover 70 to 85% of soft declines; fixed retry schedules typically land between 40 to 60%.
For a $10M ARR business losing 1 to 2% annually to involuntary churn, closing even half that gap returns $50k to $100k that no product change or cancellation flow could have reached. More subscribers retained through payment recovery means longer average lifetimes without touching acquisition cost or pricing.
Slicker's 4-month pilot (first month free, three paid months, cancel anytime) validates this on your own data via AABB testing before any long-term commitment. Performance is measured in dollars recovered with statistical significance, and Slicker only charges on revenue it actually recovers.
Final Thoughts on Separating Involuntary Churn From Your LTV Calculation
Once you split failed-payment exits from active cancellations, the picture gets sharper fast. Your LTV improves when you stop penalizing it for a problem that payment recovery can actually fix, and your retention budget stops flowing toward customers who never meant to leave. The math is straightforward; the gap just stays open until someone closes it. Connect with the Slicker team to run the numbers on your own subscriber base.
FAQs
What is involuntary churn and how is it different from a customer voluntarily canceling?
Voluntary churn is a deliberate decision: the customer weighed the value and chose to leave. Involuntary churn happens when a payment fails, access gets cut, and a subscriber who had no intention of leaving simply disappears. Industry data shows failed payments account for roughly 48% of all subscription churn, yet most billing dashboards collapse both exit types into a single rate, so the room debates product quality while a recoverable payment problem compounds every billing cycle.
How do subscription businesses typically measure involuntary churn from failed payments, and what KPIs should we track?
Start by pulling every cancellation event from your billing system and filtering by reason: separate dunning-exhaustion exits and unpaid invoice closures from active cancellations. The four KPIs that matter most are initial payment failure rate versus final failure rate after the full retry period, recovery rate on soft declines, revenue recovered as a share of MRR (monthly recurring revenue), and gross churn versus net churn. If your final failure rate sits close to your initial failure rate, the gap points to recovery infrastructure, not product or pricing.
Is involuntary churn worth tackling before other revenue and product initiatives?
For a $10M ARR business where 2% of monthly churn is involuntary, that is roughly $200k leaving each month through a gap that payment recovery can close without a single product change, repricing, or acquisition campaign. Unlike voluntary churn fixes, which require product investment or retention offers, recovering failed payments returns revenue you already earned from subscribers who already said yes. The LTV impact is direct: moving from 5% to 3% monthly churn adds roughly 13 months of average customer lifetime on a $50 monthly subscription.
How does card quality at acquisition affect involuntary churn rates across different subscriber cohorts?
Cards submitted during free-trial signups skew toward prepaid cards, virtual card numbers, and low-balance debit accounts, all of which are structurally more likely to fail at first charge. A cohort heavy with prepaid and virtual cards has a lower recovery ceiling regardless of how well your retry logic performs, because the baseline failure rate sits upstream of your billing stack. Segmenting involuntary churn by acquisition channel and payment method type before drawing conclusions about recovery infrastructure performance prevents optimizing the wrong variable while the real revenue leak goes unexamined.
What are the best alternatives to Churn Buster for AI-powered dunning and payment retries in 2026?
Churn Buster pioneered dunning email campaigns but has limited retry intelligence and no gateway routing. Slicker combines AI-powered smart retries, failure-reason-specific dunning emails, and multi-gateway orchestration in one platform, with the key differentiator being AABB testing that proves incremental recovery lift with statistical significance on your own data before any long-term commitment. Other options in the space include Butter (focused on card updater services), Revaly, and billing-platform built-ins like Chargebee Smart Dunning, all of which rely on rule-based retry schedules instead of per-transaction AI models.
Related Articles
Authorization Rate in Subscription Billing: October 2026
There's a number sitting in your payments data that most finance and retention teams never report on separately: the share of renewal charges your issuing...
Why Payment Recovery Must Live Above Billers October 2026
A payment fails. Your biller retries it three days later, then again at seven, then at fourteen. What the biller never checks is whether the issuer sent a...
Billing Migration vs Recovery Layer: The Right Call October 2026
Switching billing systems feels like the right move when revenue collection starts breaking down. Sometimes it is. But soft declines, weak retry logic, and...
Stop losing revenue to failed payments
Join leading subscription businesses using Slicker to recover failed payments automatically.
Get Started