Involuntary Churn Benchmarks by Vertical: SaaS & DTC (Oct 2026)
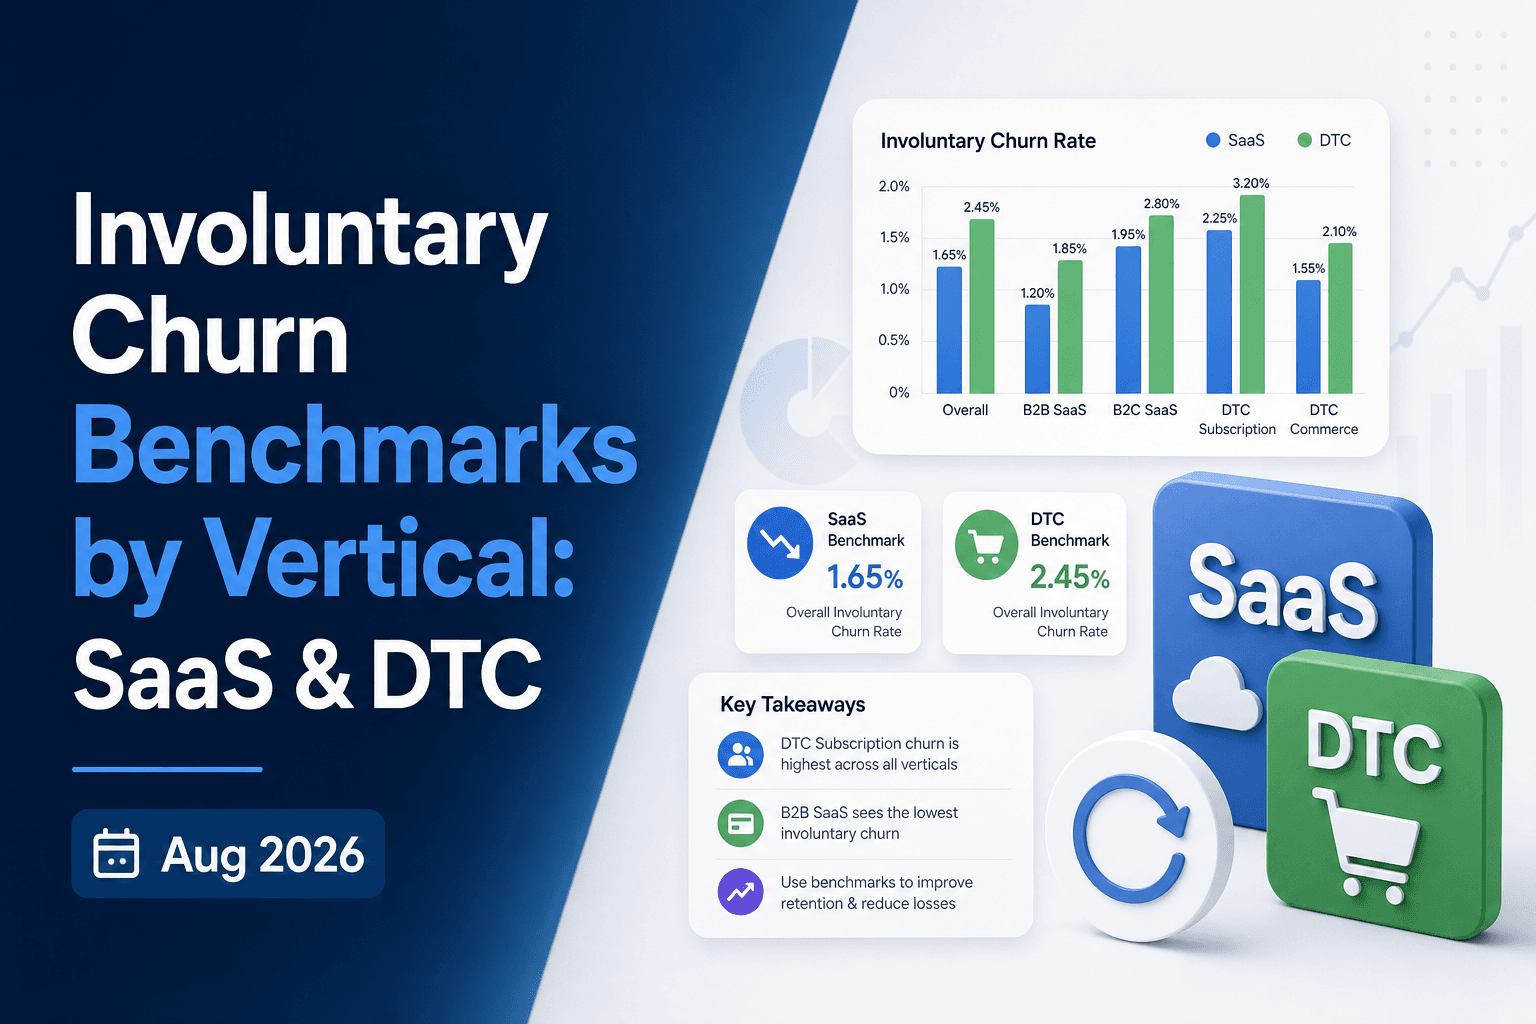
Payment failures are not a billing footnote. For subscription businesses across SaaS, DTC, and memberships, involuntary churn rate benchmarks show that a meaningful share of lost revenue comes from subscribers who said yes and kept saying yes right up until a charge quietly failed. What those numbers look like in your vertical, and why they differ so much by business model, is worth understanding before you assume your rate is normal.
TLDR:
- Involuntary churn is a payments infrastructure problem, not a product problem; it claims 20 to 40% of all subscription cancellations.
- B2B SaaS median involuntary churn runs 0.8% annually; DTC subscriptions reach 6.5 to 8.5% monthly, with subscription boxes losing 68% of churn to failed payments.
- B2C involuntary churn (24% of annual churn) outpaces B2B (16%) because personal debit cards and low-ticket billing give subscribers little reason to self-remediate.
- Segmenting by acquisition source reveals your real exposure: promotional cohorts churn at two to three times the rate of organic, full-price subscribers.
- Slicker uses AABB testing to measure recovery against your own transaction data, averaging 4.4 retry attempts per recovered failure versus 6.1 for standard configurations.
What Involuntary Churn Is (and How It Differs from Voluntary Churn)
Involuntary churn happens when a subscriber loses access not because they wanted to leave, but because a payment failed. The card declined, the bank blocked the charge, the account ran short. The subscription gets canceled anyway. The customer never made a cancellation decision.
Voluntary churn is the opposite: a subscriber actively decides to cancel, whether the product stopped fitting their needs or a competitor won them over.
These two types of churn share a metric but nothing else. Voluntary churn is a product problem. Involuntary churn is a payments infrastructure problem. Treating them the same way leads to misdiagnosed fixes, usually product investment and exit surveys, applied to customers who were never actually dissatisfied.
That distinction matters most when you look at the revenue at stake. Involuntary churn claims roughly 20 to 40% of all subscription cancellations across the industry. That revenue was already earned, from subscribers who already said yes, who had no intention of leaving. It walked out through a gap in your billing stack, not through a door they opened.
What Causes Involuntary Churn
Not all payment failures are equal, and the type of failure determines how you recover from it.
Soft declines are temporary. Insufficient funds, network timeouts, velocity limits triggered by unusual activity: these are recoverable with the right retry timing. The card is valid; the conditions just were not right.
Hard declines are permanent. A stolen card, a closed account, a fraud flag: no retry will succeed. Recovery requires the subscriber to act, typically updating their payment method or contacting their bank.
Other common failure sources include expired or reissued cards, outdated billing details, and prepaid cards that run dry. Each behaves differently. An expired card may be caught by an account updater service before a charge attempt ever fails. An insufficient funds decline on a debit card may clear within 48 hours once payroll deposits. A fraud block requires messaging that tells the subscriber exactly what action to take, not a generic "update your payment" prompt.
The downstream consequence follows the failure type directly: soft declines can often recover silently, without the subscriber ever knowing there was a problem. Hard declines cannot.
How to Calculate Your Involuntary Churn Rate
Two numbers matter here, and most teams only track one.
The failed-payment rate measures how often a charge fails on first attempt. Across subscription industries, that figure averages around 7.9%, with first-attempt failure rates for recurring payments running closer to 10%. This is what your billing dashboard usually shows.
The involuntary churn rate measures something different: how many subscribers you actually lose after all recovery attempts have run their course.
Involuntary churn rate = subscribers lost to failed payments / total active subscribers
This number will always be lower than your failed-payment rate, because some failures recover. The gap between the two tells you how well your recovery infrastructure is working.
The third calculation converts the problem into budget language. Take your unrecovered failures each month and multiply by average remaining customer lifetime value (LTV). A 2% involuntary churn rate sounds manageable; multiplied by LTV across a subscriber base of any real size, it gets a CFO's attention fast. Tracking all three together gives you a clear target for improvement.
Involuntary Churn Benchmarks: B2B SaaS
Recurly's research across 1,200-plus subscription companies puts median B2B SaaS involuntary churn rate at 0.8%, against 2.6% voluntary. Across a broader dataset of 1,500-plus subscription sites, 0.86% of monthly churn stems from payment failures.
That 0.8% is a median, not a ceiling. SMB-heavy products billed monthly skew higher; enterprise contracts with corporate cards run well below it. A subscriber base on consumer debit with monthly billing will see involuntary churn behave more like a DTC business than a B2B one.
Published industry estimates put recoverable SaaS revenue lost to involuntary churn at roughly $1.3 billion annually, a figure that reframes the problem from a billing footnote into a line item worth owning. (Figures of this scale are consistent with applying the 0.86% payment-failure churn rate from Recurly's 1,500-plus subscription-site dataset to SaaS industry revenue totals.)
Involuntary Churn Benchmarks: DTC Subscription and E-Commerce
DTC subscription businesses operate in a different league than SaaS. Average monthly churn runs 6.5 to 8.5%, with involuntary churn accounting for 25 to 40% of that total.
Vertical breakdowns show the spread clearly:
- Food and beverage subscriptions see 12 to 18% monthly churn, the highest of any consumer category, driven by high payment failure rates in the same range. See involuntary churn benchmarks by industry for a full breakdown.
- Health and wellness and beauty and personal care land between 8 and 14%, with beauty payment failure churn benchmarks.
- B2C digital subscriptions sit lowest at 4 to 7% monthly churn.
Subscription boxes represent the extreme case: involuntary churn reaches 68% of total churn. Without recovery infrastructure, the majority of those failures become permanent revenue losses, a pattern covered in depth in the passive churn recovery playbook.
Involuntary Churn Benchmarks: Membership Businesses
Fitness and wellness operators face involuntary churn rates that rival the worst DTC categories, but with less infrastructure to catch it. Payment failure rates on monthly dues transactions run roughly 7 to 12%, consistent with broader subscription billing benchmarks that put payment failures at 5 to 15% across recurring billing businesses.
HFA benchmarking data shows fitness operators lose roughly a third of their member base each year, with involuntary churn among the most preventable contributors.
The structural problem is tooling. Most gym management and association billing systems ship without native retry logic or dunning workflows. A failed dues transaction either gets flagged for manual follow-up or it doesn't get flagged at all. The gap between what is recoverable and what actually gets recovered tends to be widest here.
B2B vs. B2C Involuntary Churn: Why the Gap Exists
Churnkey's benchmarking data puts the gap in concrete terms: 24% of all annual churn for B2C companies is involuntary, compared to 16% for B2B. The structural reasons behind that spread matter more than the numbers themselves.
Factor | B2B | B2C |
|---|---|---|
Involuntary churn share of annual churn | ~16% | ~24% |
Typical payment instrument | Corporate card (stable balance, expense account) | Personal debit (paycheck-to-paycheck variability) |
Billing cadence | Often annual | Usually monthly |
Subscriber motivation to self-remediate | High: software is often mission-critical; a $12,000 failed charge gets noticed | Low: gym memberships and streaming services rarely prompt proactive monitoring |
Soft decline risk | Lower: corporate cards avoid income volatility | Higher: debit card balances fluctuate with pay cycles |
Price-point effect | Large contract values create inherent urgency to fix | $9/month fails quietly; motivation to fix scales with price |
B2B subscribers typically pay with corporate cards that carry stable balances, sit on expense accounts, and avoid the income volatility that drives soft declines on personal debit. Annual contracts create built-in renewal awareness: when a $12,000 charge fails, someone notices. And because the software is usually mission-critical, the subscriber has strong motivation to fix it before access lapses.
B2C works against you on every axis. Personal debit cards with paycheck-to-paycheck variability, monthly billing with low switching costs, and subscribers who rarely catch a failed payment before the subscription cancels. A gym membership or streaming service seldom feels urgent enough to prompt proactive account monitoring.
Within B2C, price point sharpens the gap further. A $9/month subscription fails quietly and often permanently. A $150/month subscription gets noticed. Lower-ticket consumer products see involuntary churn represent a larger share of total churn because the subscriber's motivation to self-remediate scales with what they're paying.
How Acquisition Quality Shapes Your Involuntary Churn Rate
Involuntary churn benchmarks are averages, and averages obscure the real problem. Within a single subscription business, rates can vary by a factor of two or three depending entirely on how a subscriber was acquired.
Subscribers who came in through heavy discounting, free trials, or aggressive promotional channels tend to submit lower-quality payment instruments: prepaid cards, underfunded debit accounts, or cards entered with minimal intent to convert. These cohorts churn at two to three times the rate of subscribers who paid full price from the start.
Acquisition channel compounds the effect further. App store subscribers pay through Apple or Google billing infrastructure, which introduces its own failure patterns. Paid social acquirers skew toward demographics with higher debit card usage. Organic web signups, arriving with higher purchase intent, tend to submit more stable payment instruments.
A single blended 4% subscription churn rate might reflect 1.5% among organic, full-price subscribers and 7% among promotional acquirers running at a loss through their entire lifecycle. Segmenting by acquisition source, payment method type, and subscriber tenure is how you find where the problem is actually concentrated, and where recovery investment pays off fastest.
KPIs Every Revenue Operations Team Should Track for Involuntary Churn
Most revenue operations teams track overall churn. Far fewer separate involuntary from voluntary, which means the root cause stays invisible. Research from the Merchant Risk Council confirms this gap is widespread across subscription businesses.
The core metric stack to track:
- Involuntary churn rate (subscribers lost to failed payments divided by total active subscribers)
- First-attempt failure rate on recurring charges
- Recovery rate by failure type, with soft and hard declines tracked separately
- MRR (monthly recurring revenue) at risk from open, unresolved failed invoices
- Net involuntary churn rate after all recovery attempts complete
Measure recovery rate at the invoice level, not the transaction level. A single invoice can generate multiple retry attempts, and counting each attempt separately inflates the number without reflecting actual subscribers saved.
These metrics belong in the same executive report as voluntary churn, LTV, and MRR growth. For the full list of CFO dashboard metrics for involuntary churn, keeping them visible guarantees they get the attention they deserve.
How to Reduce Involuntary Churn
Four levers reduce involuntary churn, and they apply in a specific order.
Smart retries come first. For soft declines, timing matters more than volume. Well-timed retries, aligned to payday windows, issuer behavior, and card type, measurably outperform fixed schedules on soft decline recovery. Retrying after payday clears on a consumer debit card is categorically different from retrying at noon three days later. The subscriber never knows it happened.
Dunning outreach is the fallback. When a failure requires subscriber action, because the card was stolen, expired, or flagged for fraud, automated retries will not help. The message must reflect the specific failure reason, as a failure reason dunning cadence routes each decline to the right action: a stolen card requires a different call-to-action than an expired one. Generic prompts reduce completion rates without improving recovery.
Card updater services sit upstream of everything. Visa Account Updater and Mastercard Automatic Billing Updater refresh expired or reissued credentials automatically, so the retry never needs to occur.
Grace period length is the final calibration. Extending the dunning window past day 21 rarely recovers meaningful additional revenue, while the cost of serving subscribers with outstanding failed payments continues to accrue.
Deploying the wrong lever for a given failure type costs you twice: it wastes a retry attempt or sends unnecessary outreach, and still does not recover the revenue.
How Slicker Approaches Involuntary Churn Recovery
Slicker approaches involuntary churn recovery through a single integrated system, not isolated tools. Smart retries analyze over 40 variables per transaction, including card type, issuing bank, geography, local payday cadence, and time of day, to determine whether to retry, when, and which payment method to attempt. Multi-payment-method orchestration distributes attempts across all stored instruments instead of exhausting retry limits on one failing card.
Dunning emails deploy only when customer action is genuinely required, each reflecting the specific failure reason and sending from your own domain.
The methodology behind this is documented. Slicker's retry logic averages 4.4 attempts per recovered failure versus 6.1 for standard retry configurations, as measured through AABB-tested deployments, which means fewer network fees and lower risk of card network penalties.
For finance and payments leaders who have been handed unverifiable vendor recovery claims before, how the number is proven matters as much as the number itself. Slicker uses AABB testing in payment recovery borrowed from clinical crossover trial design, splitting traffic 50/50, measuring dollars recovered, and calculating statistical significance against your own transaction data before any commitment is required. If Slicker does not outperform your control with statistical significance, you do not pay.
At a $10M MRR (monthly recurring revenue) subscription business, a 1 to 2 percentage-point improvement in involuntary churn rate protects $1.2M to $2.4M in annual recurring revenue already earned. The benchmarks in this article show where your rate likely sits; AABB testing shows exactly how much of that gap is recoverable on your specific subscriber base.
Final Thoughts on Involuntary Churn Benchmarks for Subscription Businesses
The numbers across this article point to the same conclusion: a meaningful share of your churn has nothing to do with product satisfaction, pricing, or competition. It is a payments infrastructure gap, and it is one of the more fixable revenue problems your business has. Knowing your involuntary churn rate, segmented by acquisition source and failure type, is what turns a vague billing problem into a recoverable line item. Connect with the Slicker team to find out how much of that gap is recoverable on your subscriber base.
FAQs
What is involuntary churn and how does it differ from a customer canceling their subscription?
Involuntary churn happens when a subscriber loses access because a payment failed, not because they chose to leave. The subscriber made no cancellation decision; a card decline or billing failure ended the subscription on their behalf. Voluntary churn is a product problem requiring different fixes, while involuntary churn is a payments infrastructure problem where the revenue was already earned and the subscriber already intended to stay.
What percentage of subscription payments fail, and how much of that becomes permanent involuntary churn?
First-attempt failure rates on recurring payments average around 10%, with overall failed-payment rates across subscription industries running close to 7.9%. Not all of that becomes involuntary churn: recovery infrastructure closes the gap, and the difference between your failed-payment rate and your final involuntary churn rate is a direct measure of how well that infrastructure is working. For B2B SaaS, median annual involuntary churn sits around 0.8%; DTC subscription businesses run materially higher, between 25 and 40% of total churn.
What KPIs should a SaaS revenue operations team track to measure involuntary churn recovery?
Track five numbers together: involuntary churn rate (subscribers lost to failed payments divided by total active subscribers), first-attempt failure rate on recurring charges, recovery rate split by soft and hard declines separately, MRR at risk from open unresolved failed invoices, and net involuntary churn rate after all recovery attempts complete. Measure recovery at the invoice level, not the transaction level, since a single invoice can generate multiple retry attempts and counting each attempt separately overstates actual subscribers saved.
Why does involuntary churn vary so much between different subscriber cohorts within the same business?
Acquisition quality drives most of the variation. Subscribers who came in through free trials, heavy discounts, or promotional channels tend to submit lower-quality payment instruments: prepaid cards, underfunded debit accounts, or cards entered with low intent to convert. These cohorts churn at two to three times the rate of full-price, organic subscribers. A blended 4% involuntary churn rate can mask 1.5% among organic subscribers and 7% among promotional acquirers, so segmenting by acquisition channel, payment method type, and subscriber tenure is how you find where recovery investment pays off fastest.
Stripe Smart Retries vs. a dedicated payment recovery platform like Slicker: which recovers more revenue?
Slicker's documented tests show fewer retry attempts per recovered failure, reducing network fee exposure. The performance difference is proved through AABB testing against your own transaction data before any commitment, so the comparison is on your specific subscriber base, not industry averages.
Related Articles
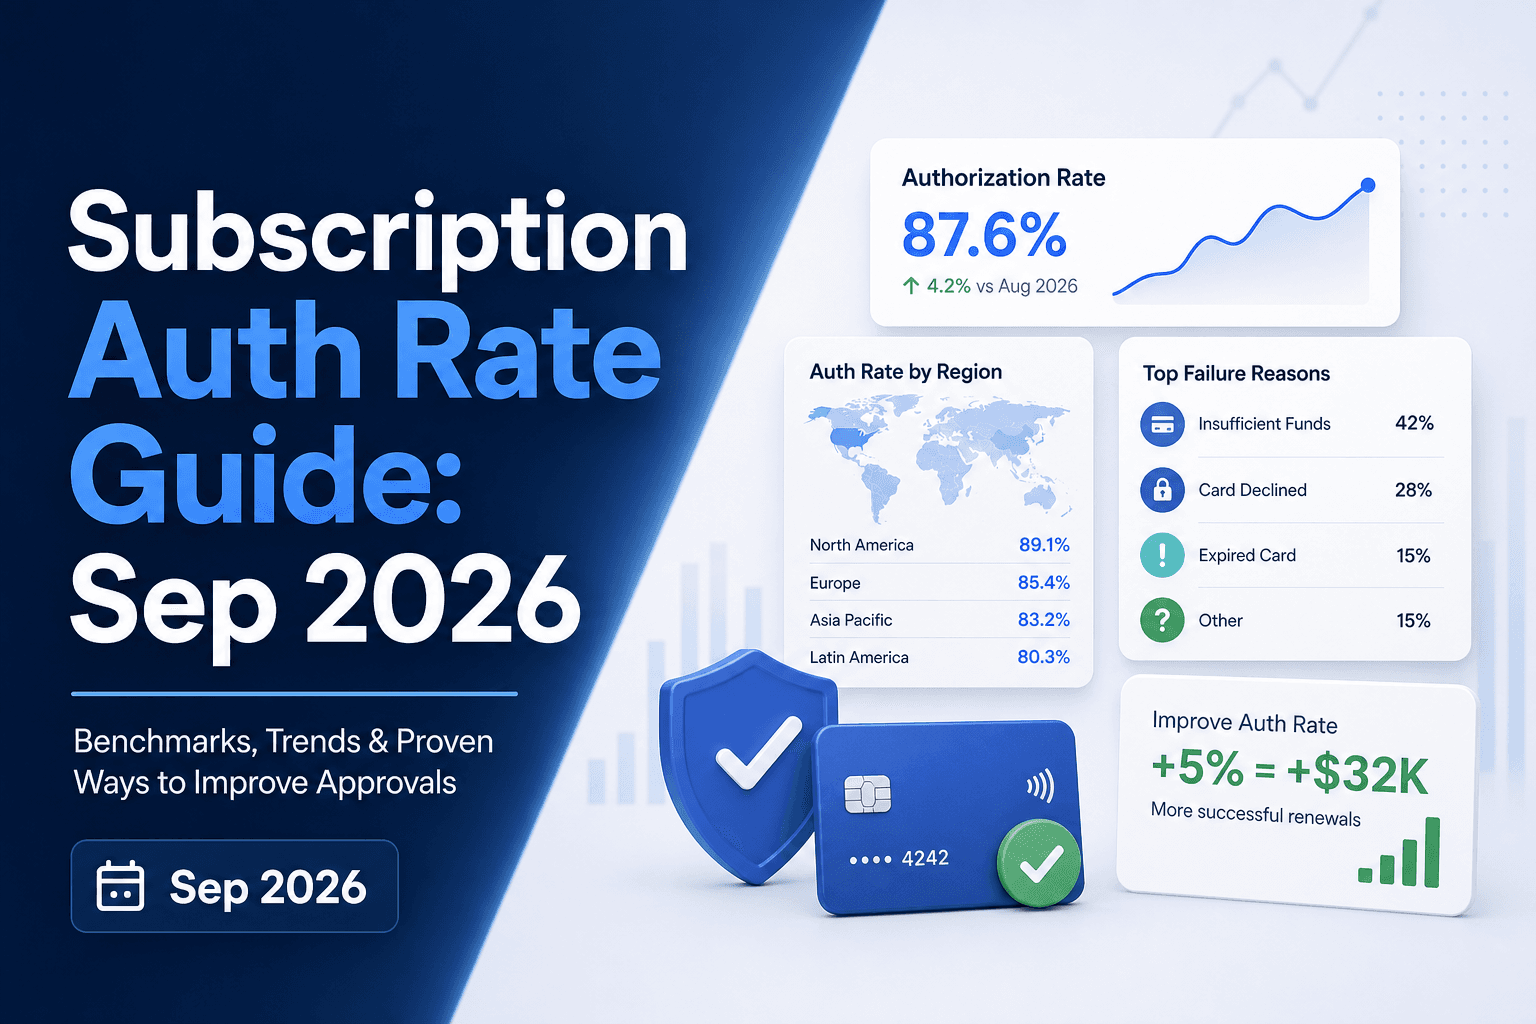
Authorization Rate in Subscription Billing: October 2026
There's a number sitting in your payments data that most finance and retention teams never report on separately: the share of renewal charges your issuing...
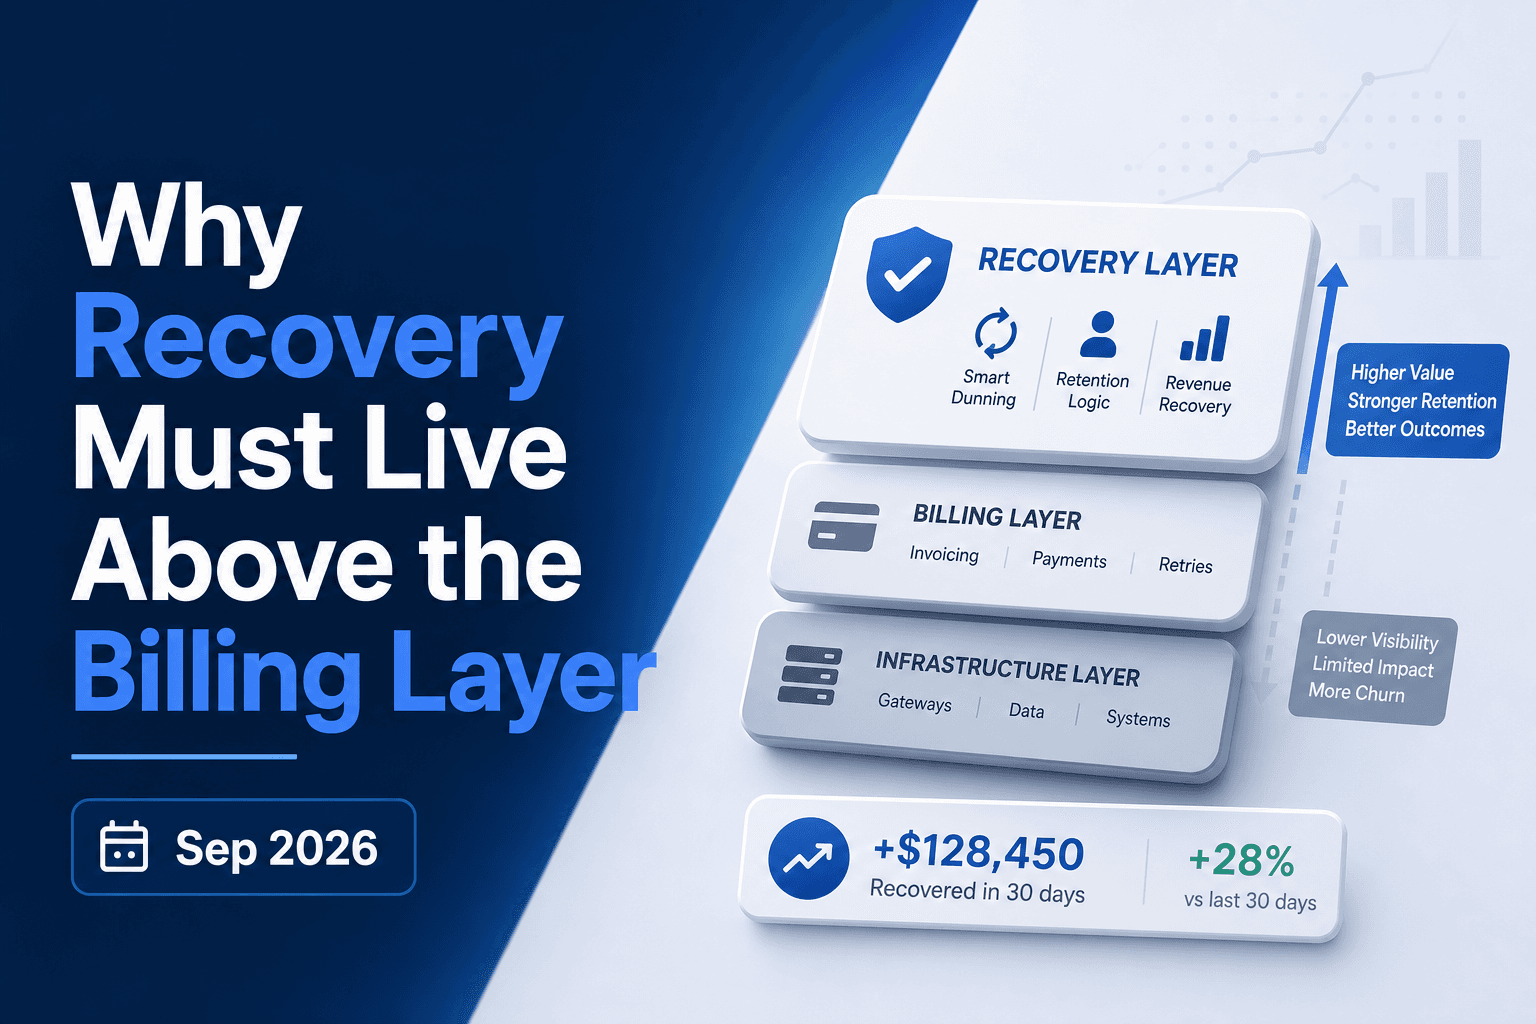
Why Payment Recovery Must Live Above Billers October 2026
A payment fails. Your biller retries it three days later, then again at seven, then at fourteen. What the biller never checks is whether the issuer sent a...
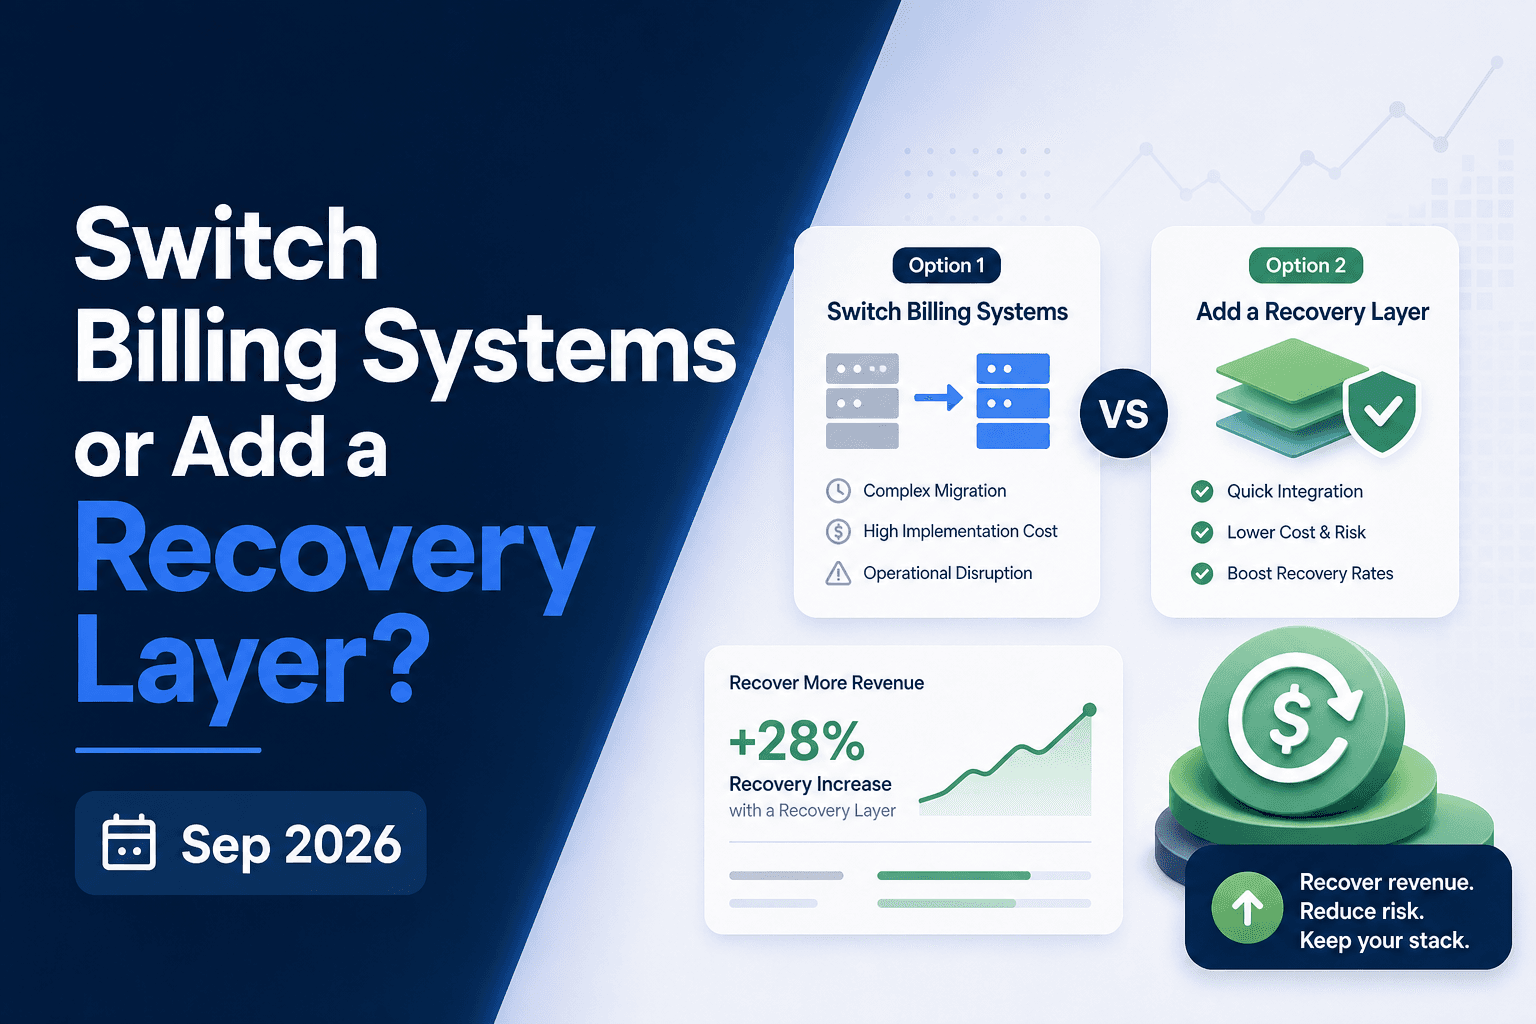
Billing Migration vs Recovery Layer: The Right Call October 2026
Switching billing systems feels like the right move when revenue collection starts breaking down. Sometimes it is. But soft declines, weak retry logic, and...
Stop losing revenue to failed payments
Join leading subscription businesses using Slicker to recover failed payments automatically.
Get Started